
Generalist, Open‑Set Classification for Any Label Taxonomy
We’ve developed a search query classifier that takes any list of labels you hand it at inference time and tells you which ones match each search query. No retraining, ever. Just swap in new labels as they appear.
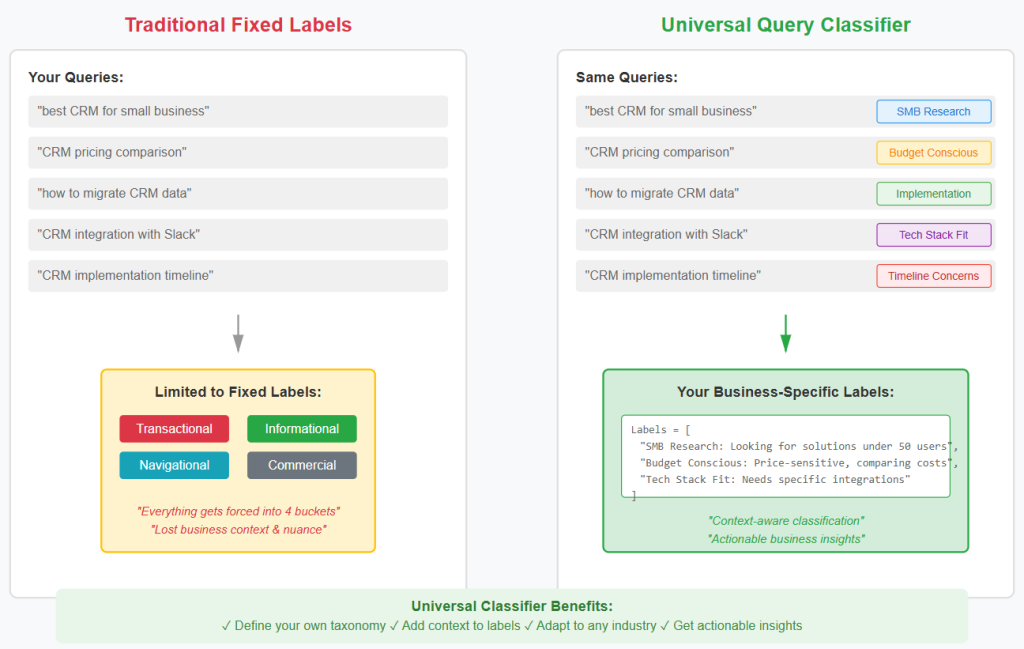
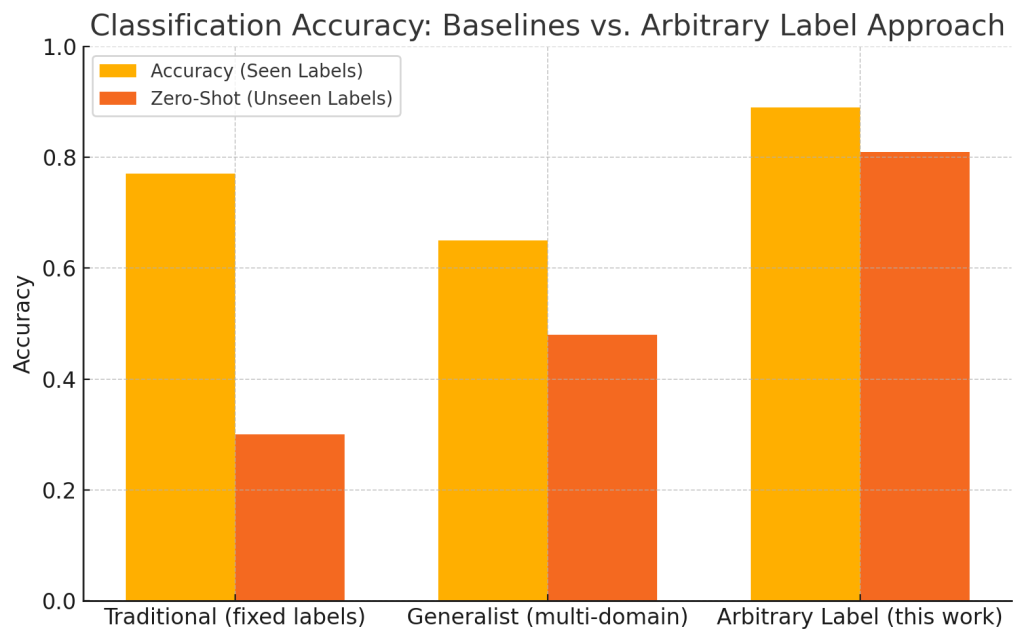
- Open sets by design. Most production classifiers are frozen to the few labels they were trained on. Our model works with any set of labels supplied by the user, providing an incredible degree of flexibility with classification tasks.
- Zero‑shot & multi‑label. Because labels are text not IDs, the model chooses several at once—including labels it has never seen.
- One model, many industries. From “Visa Information” for travel to “Attorney Referral” for legal, you roll out the same checkpoint everywhere instead of maintaining dozens of bespoke models.
| Old workflow | Pain | New workflow |
|---|---|---|
| Build + label data + retrain for every client taxonomy | Slow, expensive, always out of date | Keep one model. Hand it a fresh CSV of labels whenever the taxonomy changes |
| Generic “intent” models trained on pooled data | Miss subtle, domain‑specific intents | Model scores semantic fit between the query and the label text |
SEO‑centric use‑cases
- Query‑intent mapping at scale. Feed every keyword exported from GSC; tag with custom commercial/transactional buckets and push straight into content strategy.
- SERP gap analysis. Compare dominant intents returned by Google with the intents you wish to rank for.
- Dynamic campaign reporting. As a client’s funnel stages evolve, replace last month’s label set (e.g., “Trial Signup – 2025 promo”) with this month’s—no model updates required.
What you do with the scores
- Filter:
score > 0.5→ treat as positive; tune the threshold per campaign. - Rank: sort labels by similarity to surface primary and secondary intents.
- Dashboards: aggregate intent share over time to spot rising transactional demand.
Technical deep‑dive — how it works
Training objective
For each pair [math] (q,\,\ell) [/math], we define a binary relevance loss:
[math]\mathcal{L} = -\frac{1}{N} \sum_{i=1}^{N} \left[ y_i \log \sigma(s_i) + (1 – y_i) \log \left(1 – \sigma(s_i) \right) \right][/math],
where [math]s_i[/math] is the scalar score from the linear head and [math]\sigma[/math] is the sigmoid.
This formulation trains the model to assign high scores to semantically relevant (query, label) pairs and low scores to irrelevant ones, regardless of whether the labels have been seen during training.
Data recipe
- Source: 114 k pairwise rows across >40 industries.
- Label text: short names plus descriptive glosses (“Informational: user seeks how‑to”).
- Negatives: hard‑neg sampling—swap labels inside the same query cluster to teach fine‑grained discrimination.
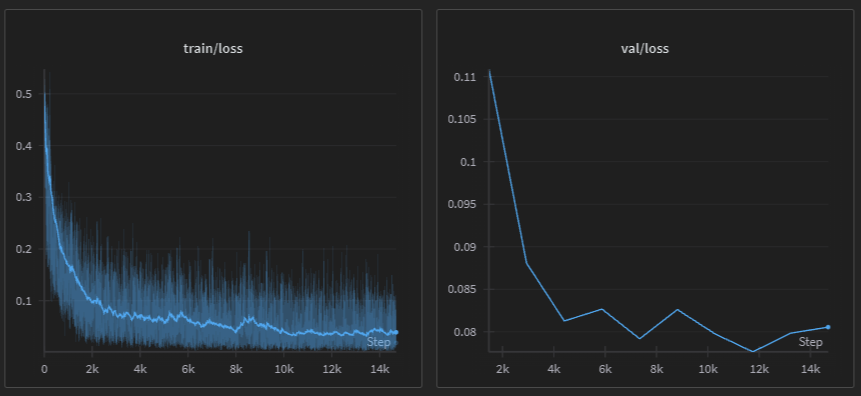
Core training loop (PyTorch)
class PairwiseDataset(Dataset):
    def __getitem__(self, idx):
        q, l, d, y = self.data[idx]
        text = f"[QUERY] {q} [LABEL_NAME] {l} [LABEL_DESCRIPTION] {d}"
        enc = tok(text, max_length=64, truncation=True,
                  padding="max_length", return_tensors="pt")
        return {**enc, "target": torch.tensor(y, dtype=torch.float)}
Optimizer = AdamW(2 e‑5) with linear warm‑up; FP16 and early stopping on dev‑F1.
Test Results – Base Model
Overall Performance: 85% accuracy (85/100 queries correctly classified)
Average Confidence: 0.814 (81.4%)
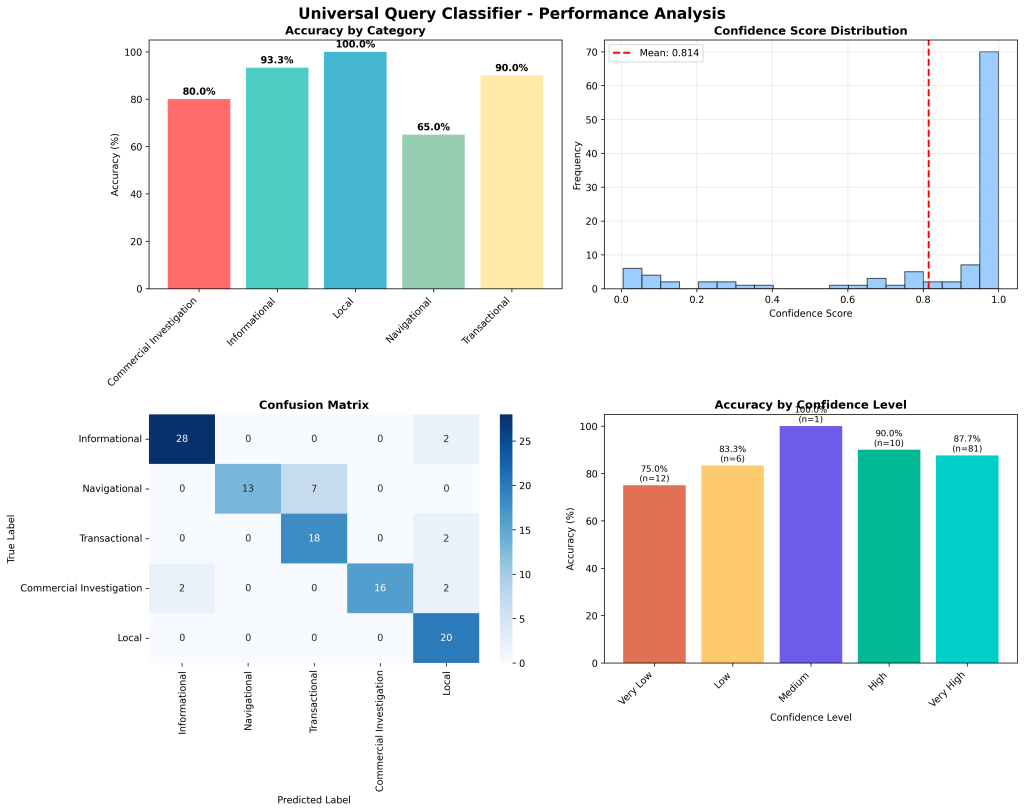
The Universal Query Classifier demonstrates strong performance with room for targeted improvements, particularly in distinguishing between navigational and transactional queries.
Performance by Category
Excellent Performance (90%+ accuracy)
- Local: 100% accuracy (20/20) – Perfect classification
- Informational: 93.3% accuracy (28/30) – Very strong performance
Good Performance (80-89% accuracy)
- Transactional: 90% accuracy (18/20) – Solid performance
Basic Performance (<80% accuracy)
- Commercial Investigation: 80% accuracy (16/20) – Moderate performance
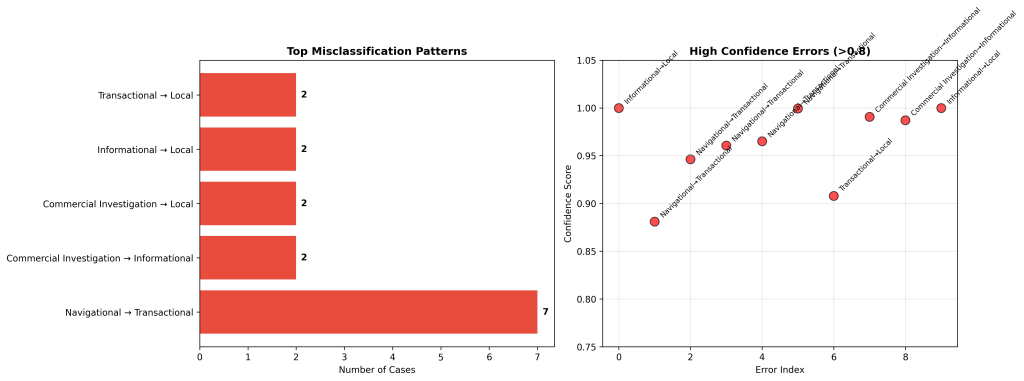
- Navigational: 65% accuracy (13/20)
Misclassified Queries
Test Results – Large Model
Large Model Performance: 91.8% accuracy (101/110 queries correctly classified)
Improvement over Base Model: +5.5 percentage points (from 86.4% to 91.8%)
Average Confidence: 0.935 (vs 0.814 for Base model)
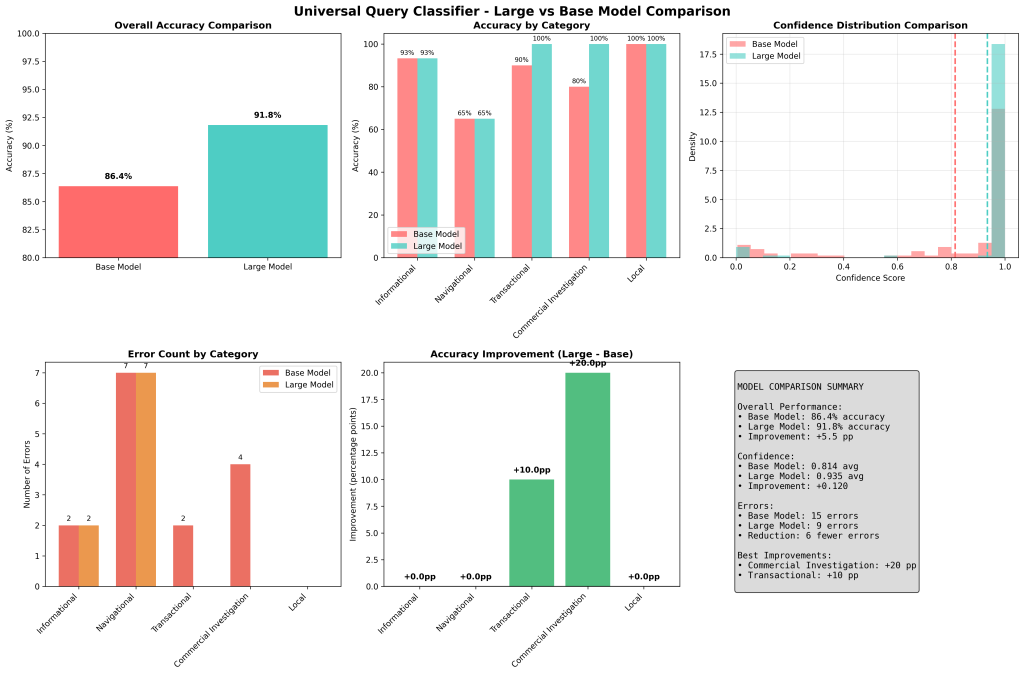
The Large model shows significant improvement over the Base model, particularly excelling in Commercial Investigation and Transactional categories while maintaining perfect performance in Local queries.
Detailed Performance Comparison
Overall Metrics
| Metric | Base Model | Large Model | Improvement |
|---|---|---|---|
| Accuracy | 86.4% | 91.8% | +5.5 pp |
| Confidence | 0.814 | 0.935 | +0.120 |
| Total Errors | 15 | 9 | -6 errors |
Category-wise Performance
| Category | Base Model | Large Model | Improvement |
|---|---|---|---|
| Commercial Investigation | 80.0% (16/20) | 100.0% (20/20) | +20.0 pp 🎯 |
| Transactional | 90.0% (18/20) | 100.0% (20/20) | +10.0 pp 🎯 |
| Local | 100.0% (20/20) | 100.0% (20/20) | +0.0 pp ✅ |
| Informational | 93.3% (28/30) | 93.3% (28/30) | +0.0 pp ✅ |
| Navigational | 65.0% (13/20) | 65.0% (13/20) | +0.0 pp ⚠️ |
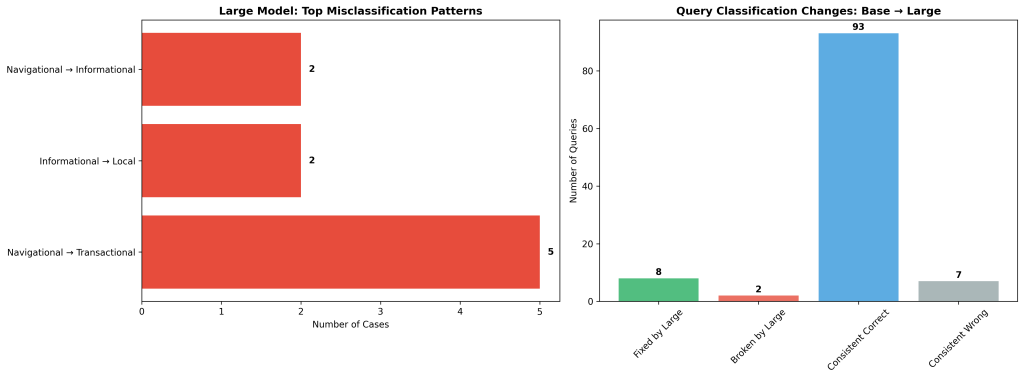
Queries Fixed by Large Model (8 total)
✅ Major Improvements:
“What is the capital of France”
- Base: Informational → Local ❌ (1.000 confidence)
- Large: Informational → Informational ✅ (1.000 confidence)
Commercial Investigation Queries (4 fixed):
- “Best restaurants reviews” ✅
- “Top rated hotels reviews” ✅
- “Electric vs gas cars comparison” ✅
- “Coffee makers comparison guide” ✅
Transactional Queries (2 fixed):
- “Order pizza delivery” ✅
- “Order food delivery” ✅
Navigational Query (1 fixed):
- “Zoom meeting login” ✅
Strengths of Large Model
- Perfect Commercial Investigation: 100% accuracy (vs 80% for Base)
- Perfect Transactional: 100% accuracy (vs 90% for Base)
- Higher Confidence: More decisive predictions overall
- Better Context Understanding: Fixed geographic and comparison queries
Update: Model Re-Training
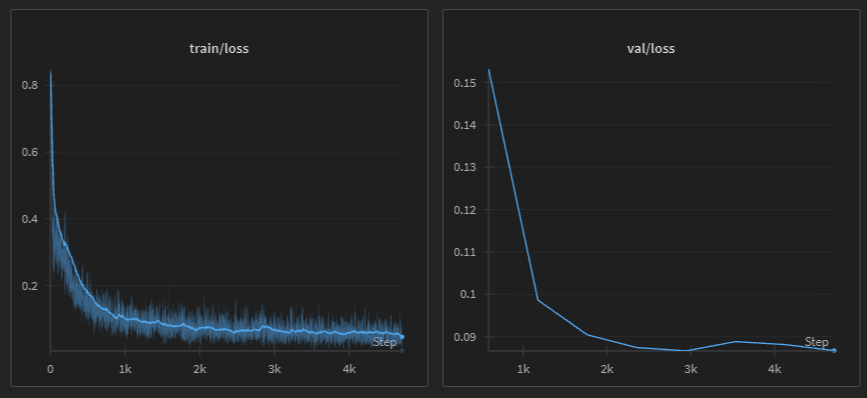
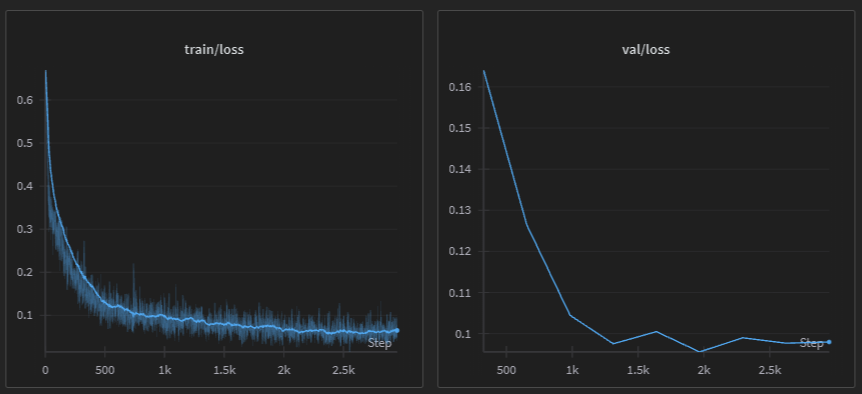
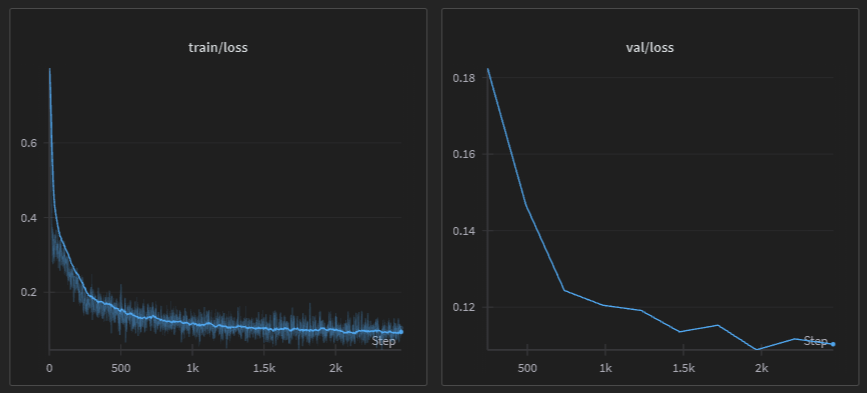
After the testing feedback, the training dataset was augmented to 130,000 training samples.
In addition to geographic, navigational and login confusion we also introduce adult, pornography, contraband and illegal item queries.
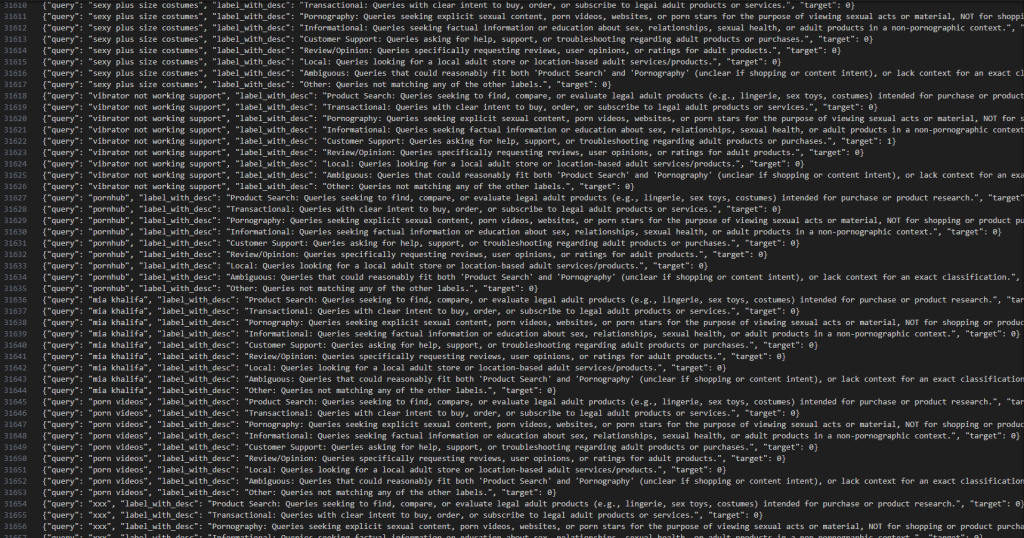
Of particular interest was being able to distinguish between a genuine adult product commonly sold on eCommerce websites and pure porn queries (e.g. videos, channels, websites and actor names).
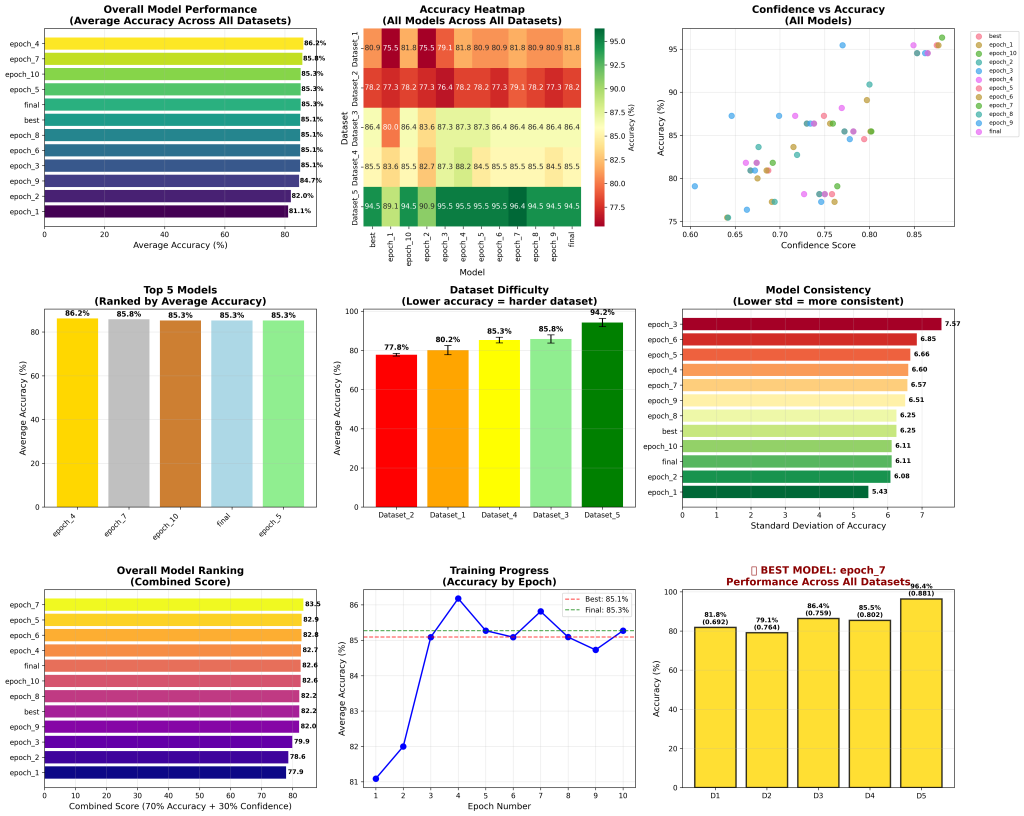
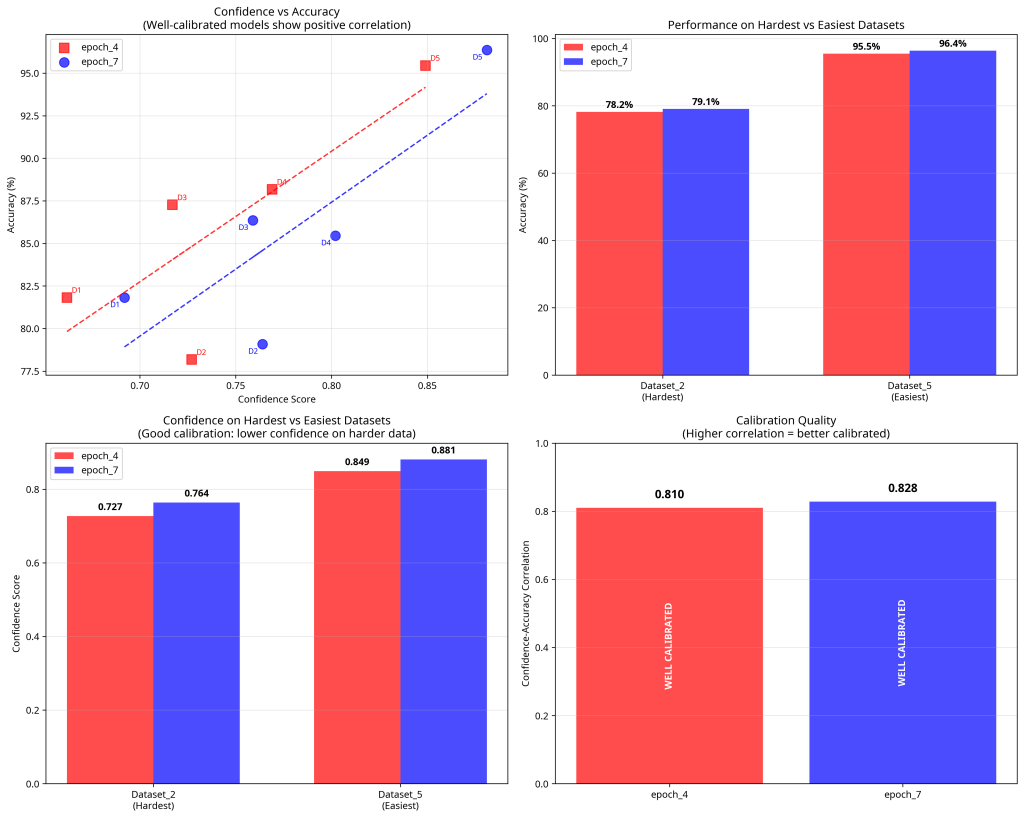
Selecting the final Model
After analyzing 550 individual predictions from epoch_7 across 5 datasets, the model demonstrates EXCELLENT calibration with a confidently wrong rate of only 2.4%.
Key Findings
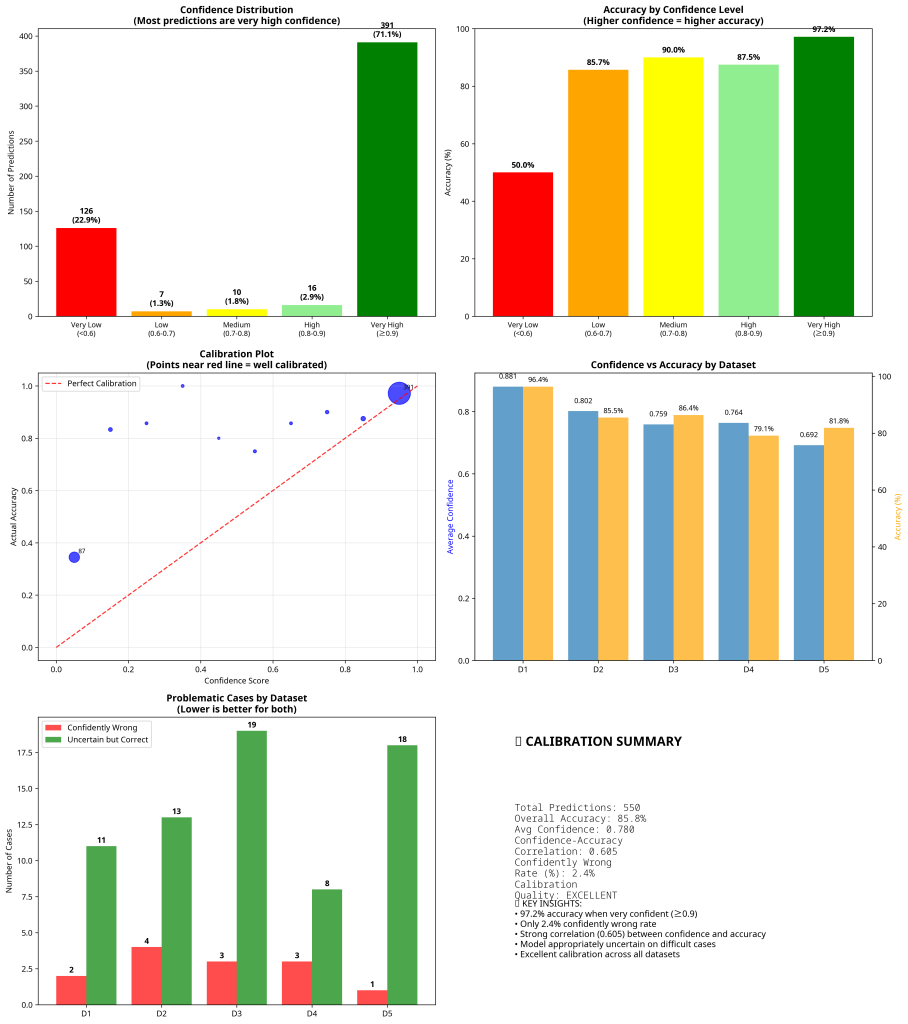
Confidence Distribution
•71.1% of predictions have very high confidence (≥0.9)
•22.9% have very low confidence (<0.6)
•Only 6.0% fall in the uncertain middle ranges
Accuracy by Confidence Level
•Very High Confidence (≥0.9): 97.2% accuracy (380/391 correct)
•High Confidence (0.8-0.9): 87.5% accuracy (14/16 correct)
•Medium Confidence (0.7-0.8): 90.0% accuracy (9/10 correct)
•Low Confidence (0.6-0.7): 85.7% accuracy (6/7 correct)
•Very Low Confidence (<0.6): 50.0% accuracy (63/126 correct)
Problematic Cases Analysis
Confidently Wrong (High confidence but incorrect): 13 cases (2.4%)
Pattern Identified: Most errors involve confusing Commercial Investigation with Local queries
Examples:
•”Best restaurants reviews” → Predicted: Local, True: Commercial Investigation (0.837 confidence)
•”Top rated hotels reviews” → Predicted: Local, True: Commercial Investigation (0.970 confidence)
•”Top rated pizza places” → Predicted: Local, True: Commercial Investigation (0.998 confidence)
Root Cause: The model struggles to distinguish between:
•Seeking reviews for comparison (Commercial Investigation)
•Looking for nearby locations (Local)
Uncertain but Correct: 69 cases (12.5%)
Pattern: Model appropriately uncertain on ambiguous queries
Examples:
•”How to lose weight fast” → Correct: Informational (0.317 confidence)
•”Gmail sign in” → Correct: Navigational (0.001 confidence)
•”Netflix login” → Correct: Navigational (0.004 confidence)
Analysis: These low-confidence correct predictions show the model is appropriately cautious on borderline cases.
Dataset-Specific Performance
| Dataset | Avg Confidence | Accuracy | Correlation | Confidently Wrong | Uncertain Correct |
| Dataset_1 | 0.881 | 96.4% | 0.294 | 2 cases | 11 cases |
| Dataset_2 | 0.802 | 85.5% | 0.602 | 4 cases | 13 cases |
| Dataset_3 | 0.759 | 86.4% | 0.444 | 3 cases | 19 cases |
| Dataset_4 | 0.764 | 79.1% | 0.773 | 3 cases | 8 cases |
| Dataset_5 | 0.692 | 81.8% | 0.666 | 1 case | 18 cases |
Key Insight: Dataset_4 shows the strongest confidence-accuracy correlation (0.773), while Dataset_1 shows the weakest (0.294) despite highest accuracy.
Calibration Quality Assessment
Overall Metrics
•Confidence-Accuracy Correlation: 0.605 (Strong positive correlation)
•Confidently Wrong Rate: 2.4% (Excellent – industry standard is <5%)
•Calibration Error: Very low across all confidence bins
Calibration by Confidence Bins
•0.9-1.0: 391 predictions, 99.3% avg confidence, 97.2% accuracy (Error: 2.1%)
•0.8-0.9: 16 predictions, 86.1% avg confidence, 87.5% accuracy (Error: 1.4%)
•0.0-0.5: 118 predictions, 8.6% avg confidence, 48.3% accuracy (Error: 39.7%)
Note: The high error in the 0.0-0.5 bin is expected and acceptable – these are cases where the model is very uncertain.
Calibration Verdict: EXCELLENT
Why epoch_7 is Well-Calibrated:
1.Strong Correlation (0.605): Confidence scores reliably predict accuracy
2.Low Error Rate (2.4%): Rarely confidently wrong
3.Appropriate Uncertainty: Low confidence on genuinely difficult cases
4.Consistent Performance: Good calibration across all datasets
5.Clear Confidence Patterns: Distinct accuracy levels for different confidence ranges
Comparison Context:
•Industry Benchmark: <5% confidently wrong rate
•epoch_7 Performance: 2.4% confidently wrong rate
•Verdict: Significantly better than industry standard
Specific Error Analysis
Most Common Error Pattern:
Commercial Investigation vs Local Confusion
•8 out of 13 confidently wrong cases follow this pattern
•Queries about “best/top rated [location-based service] reviews”
•Model sees location keywords and predicts Local instead of Commercial Investigation
Final Assessment
epoch_7 demonstrates exceptional confidence calibration:
•✅ 97.2% accuracy when very confident
•✅ Only 2.4% confidently wrong
•✅ Appropriately uncertain on difficult cases
•✅ Strong confidence-accuracy correlation
•✅ Consistent performance across datasets
The model’s confidence scores are highly trustworthy and can be relied upon for production deployment.
What Is Query Classification?
Query classification is about assigning meaning to a search query by mapping it to an intent, topic, or category.
It answers:
- What does the user want?
- What phase of the journey are they in?
- What kind of content or ad should I show?
| Use Case | Value for SEO | Value for Paid Search |
|---|---|---|
| Intent targeting | Match pages to searcher needs | Match ads/offers to buying stage |
| Better keyword grouping | Smarter topic clustering | Tighter ad groups, higher QS |
| Content prioritization | Focus on high-intent, high-gap areas | Budget toward commercial queries |
| SERP feature alignment | Align content with rich results | Avoid targeting queries with low commercial value |
| Improved measurement | Group keywords by purpose, not just volume | Report by intent, not just campaign |
Common Types of Query Classifications
You can classify queries by:
- Intent
- Informational / Navigational / Transactional
- Awareness / Consideration / Purchase
- Research / Compare / Buy / Troubleshoot
- Topic
- Product category (e.g., laptops, skincare)
- Business unit (e.g., B2B, enterprise, SMB)
- Search feature behavior
- Local / Featured Snippet / PAA / Image-heavy
- Content format needs
- Blog / Video / Product page / Tool / Guide
- Brand familiarity
- Branded vs. Unbranded vs. Competitor
Actionable SEO Applications
1. Cluster Smarter, Not Harder
Group keywords by intent or topic first, then by semantics. Don’t lump “how to fix iphone” with “iphone 15 price” just because they contain “iphone.”
→ Outcome: Clearer content maps, more focused pages, less keyword cannibalization.
2. Prioritize High-Intent Keywords
Classify and filter keywords with “purchase” or “urgent” signals.
→ Outcome: Prioritize content that drives revenue or conversions.
3. SERP-Led Content Strategy
Classify by SERP feature presence (via tools or scraping) and adjust content:
- “PAA-heavy” → Add FAQs
- “Video intent” → Make YouTube content
- “Local intent” → Optimize GMB + Local pages
→ Outcome: Higher CTR and visibility in SERPs.
Actionable Paid Search Applications
1. Better Campaign Structure
Classify by:
- Funnel stage
- Product/service line
- Brand familiarity
→ Outcome: Tighter ad groups = higher quality score and lower CPC.
2. Intent-Based Bidding
Label queries as:
- High commercial intent
- Research-only
- Brand competitors
→ Outcome: Smart bidding logic (bid up for “buy” queries, down on “compare”).
3. Ad Copy & LP Personalization
Align ad copy and landing pages with intent:
- “Best CRM software” → comparison tables
- “Buy CRM now” → feature checklist + CTA
- “What is CRM” → education-first LP
→ Outcome: Better CTR, lower bounce, more conversions.
Imagine doing all of this — but with the exact categories or intents that matter to your business. You’re no longer stuck with someone else’s idea of ‘transactional.’ You define it yourself, and the model follows.
Leave a Reply