
We asked Google’s open-weight model Gemma 4 (31B) to “name 100 brands at random” 14,044 times and compared the results to our earlier Gemini 3 Flash experiment (200,000 runs).
Of the top 50 brands in each model, 39 overlap. The 11 that are unique to each reveal a pattern: Gemini remembers luxury and automotive (Porsche, Ferrari, Cartier), while Gemma remembers everyday retail and sportswear (H&M, Gap, Levi’s, Under Armour).
Apple is the undisputed #1 in both models. After that, the two models diverge significantly: Gemma 4 favors traditional consumer brands (Coca-Cola, Toyota, McDonald’s) while Gemini favors tech and digital brands (Google, Nike, Netflix).
Background
In our earlier study, we probed Gemini 3 Flash with 200,000 independent “name 100 brands at random” queries. The non-uniform output revealed a stable hierarchy of brand recall — what we called the model’s “cognitive prioritization.” That work used Personalized PageRank on a two-level association graph to rank 2.9 million brands by associative embeddedness.
This follow-up applies Phase 1 of the same methodology — the seed establishment survey — to Gemma 4 (31B), Google’s open-weight model. The goal is to answer a simple question: does an open model remember the same brands as a closed one?
Methodology
The setup mirrors the Gemini study with minor adjustments:
- Model: Gemma 4 31B Instruct (
gemma-4-31b-it) via the Google GenAI API - Prompt:
name 100 brands at random, one per line, say nothing else - Runs: 14,044 successful completions (out of 100,000 attempted; rate-limited at 30 RPM)
- Canonicalization: Local string normalization (lowercase, strip accents, spaces, hyphens, punctuation) rather than LLM-based canonicalization. For example:
La Roche-Posaybecomeslarocheposay,Coca-Colabecomescocacola - Scoring: Popularity = frequency x (1 / average position). A brand mentioned in every run at position 1 scores maximally. A brand mentioned frequently but late in lists scores lower.
The prompt was simplified from the Gemini version (which included all lowercase, no spaces, no hyphens) because we wanted to preserve the model’s natural casing as the display name and derive the canonical form programmatically.
Caveat on sample size
Gemma 4’s rate limits (30 RPM, 14,400 RPD) constrained us to 14,044 runs versus Gemini’s 200,000. The top-of-list rankings are stable at this sample size — the top 20 brands appeared in virtually every run. Long-tail discovery is ongoing: the discovery curve has not plateaued, meaning there are brands the model knows but hasn’t yet surfaced.
Results
Overview
| Metric | Gemini 3 Flash | Gemma 4 31B |
|---|---|---|
| Total runs | 200,000 | 14,044 |
| Unique brands discovered | 8,608 | 2,602 |
| Total brand mentions | 19,995,027 | 1,403,534 |
| Avg brands per run | ~100 | ~100 |
| Singleton brands (appeared once) | — | 912 (35%) |
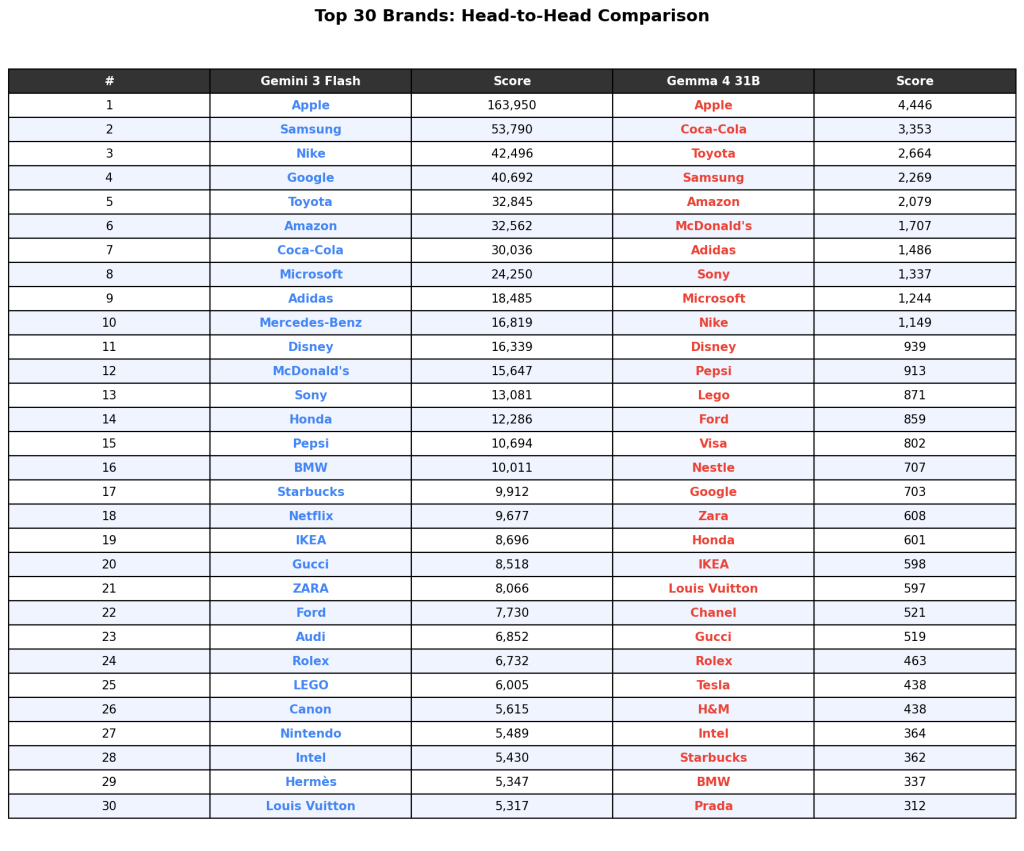
Top 30 Head-to-Head
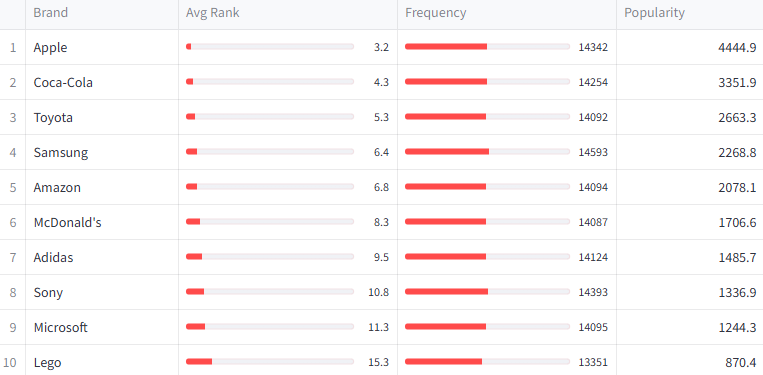
The table below shows each model’s top 30 brands ranked by popularity score. Both models agree on Apple at #1 with a commanding lead. After that, the ordering diverges.
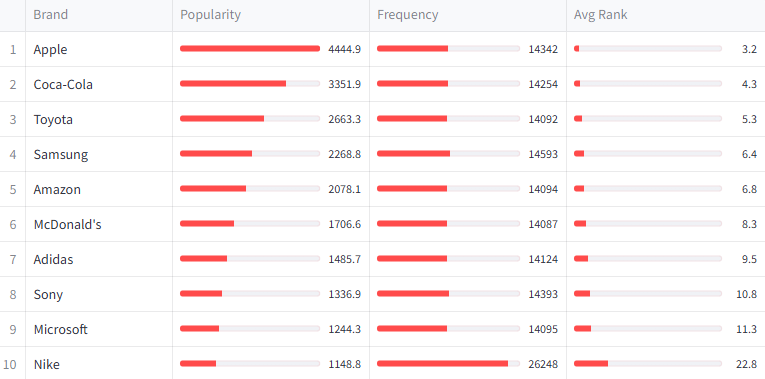
Top 20 Side-by-Side
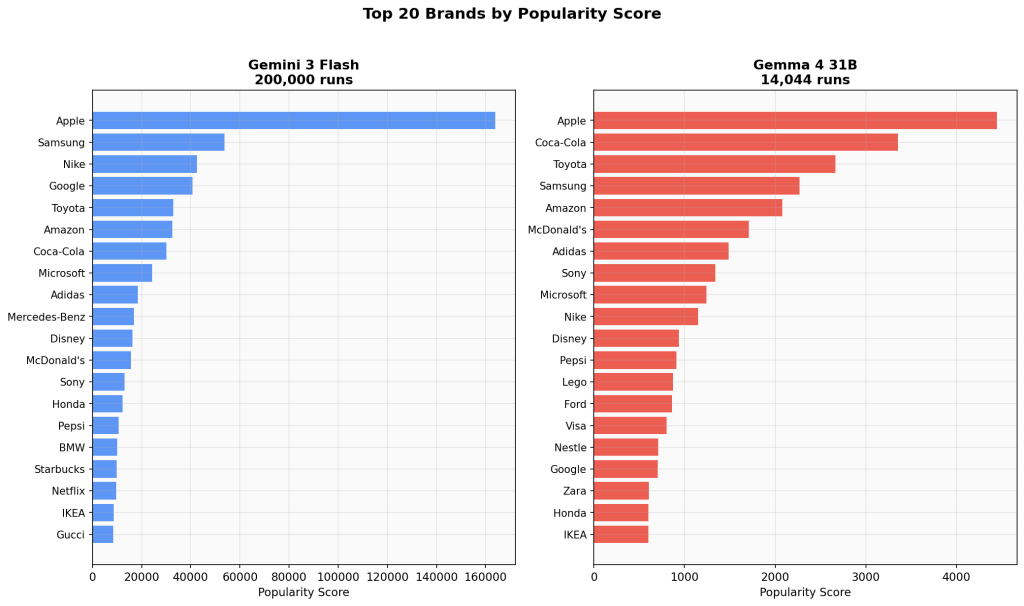
Apple dominates both models. In Gemini, the drop-off from #1 to #2 is 3:1 (Apple to Samsung). In Gemma 4, it’s 1.3:1 (Apple to Coca-Cola) — a less extreme concentration.
The Google Self-Ranking Gap
One of the most notable findings: Google ranks itself #4 in Gemini 3 Flash but only #17 in Gemma 4. This is consistent with the architectural difference — Gemini is a proprietary model trained and served by Google, while Gemma is an open-weight model. Whether this reflects training data differences, alignment tuning, or genuine differences in brand salience across model architectures is an open question.
Rank Shifts
The following chart shows how brands moved between the two models’ rankings. Green bars indicate brands that ranked higher in Gemma 4; red bars indicate brands that ranked higher in Gemini.
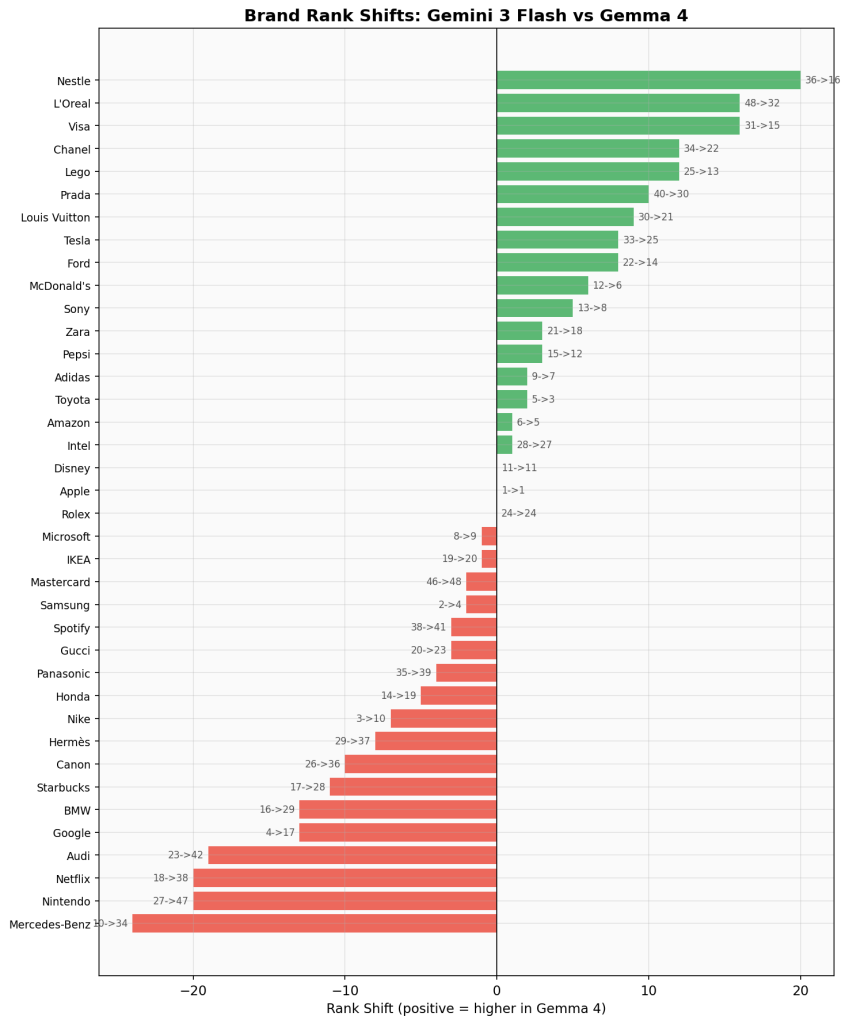
Biggest risers in Gemma 4:
- Nestle: #36 to #16 (+20)
- L’Oreal: #48 to #32 (+16)
- Visa: #31 to #15 (+16)
- Chanel: #34 to #22 (+12)
- Lego: #25 to #13 (+12)
Biggest fallers in Gemma 4:
- Mercedes-Benz: #10 to #34 (-24)
- Netflix: #18 to #38 (-20)
- Nintendo: #27 to #47 (-20)
- Audi: #23 to #42 (-19)
- Google: #4 to #17 (-13)
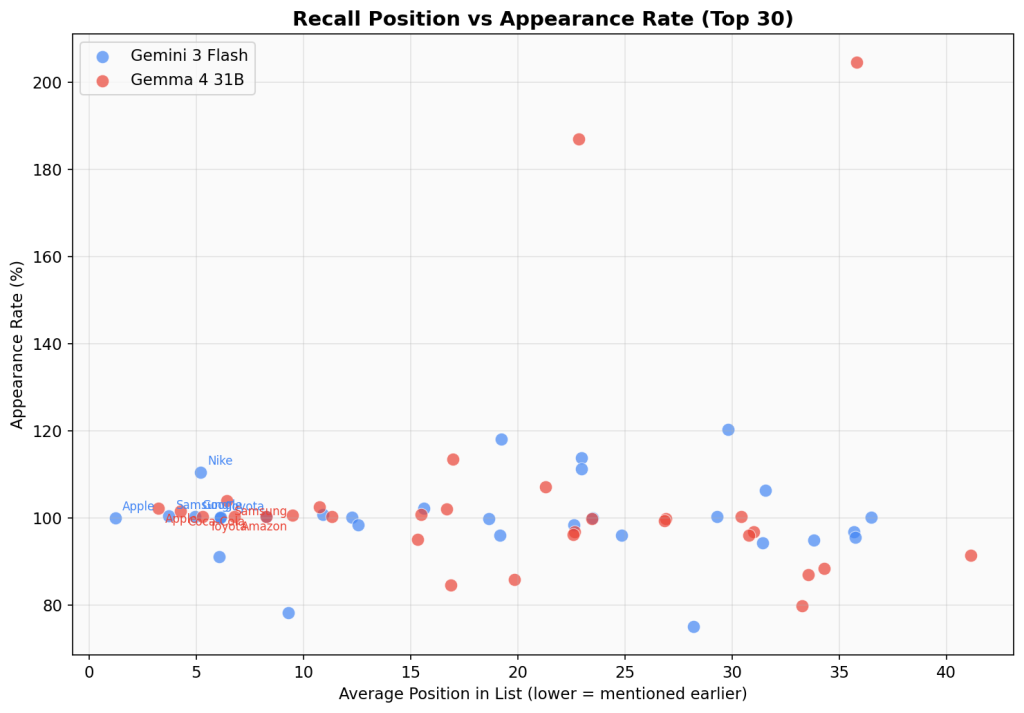
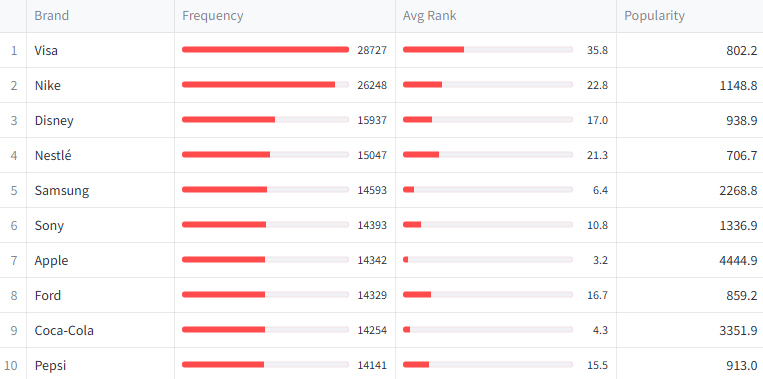
The Frequency vs. Position Paradox
An interesting pattern emerged in Gemma 4 that was less pronounced in Gemini: some brands have extremely high frequency (appearing in more runs than the total run count) but rank low by popularity because they appear late in lists.
Visa appeared 28,731 times across 14,044 runs — an average of 2.05 times per run. But its average position was 35.8, placing it 15th by popularity despite having the highest raw frequency. Nike similarly appeared 26,254 times (1.87 per run) with an average position of 22.8.
This suggests these brands have high availability in the model’s memory but low priority — they’re easy to recall but not the first thing the model thinks of. In Gemini, this effect was less extreme because the prompt forced lowercase single-word output, reducing duplicate mentions.
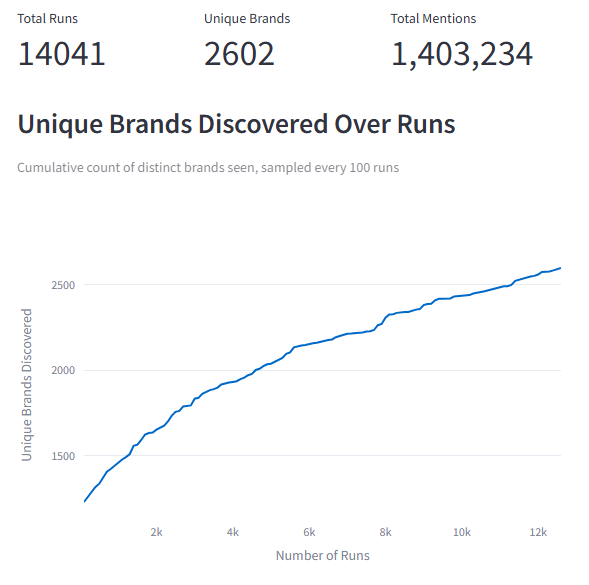
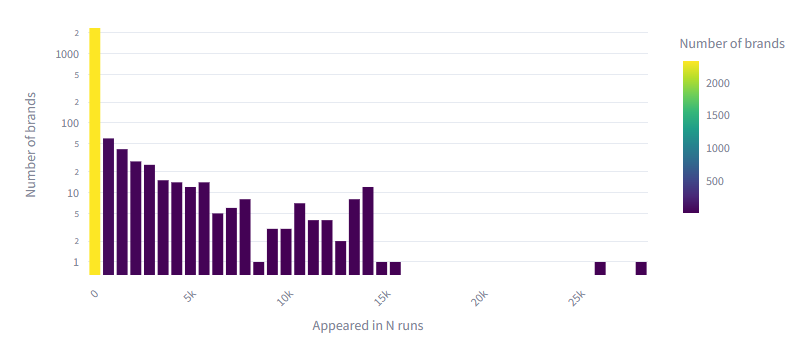
Brand Discovery Curve
The discovery curve shows how many unique brands have been surfaced as a function of runs completed. Gemma 4’s curve at 14,000 runs tracks slightly above Gemini’s curve at the same point, suggesting comparable or slightly higher brand vocabulary diversity at equivalent sample sizes.
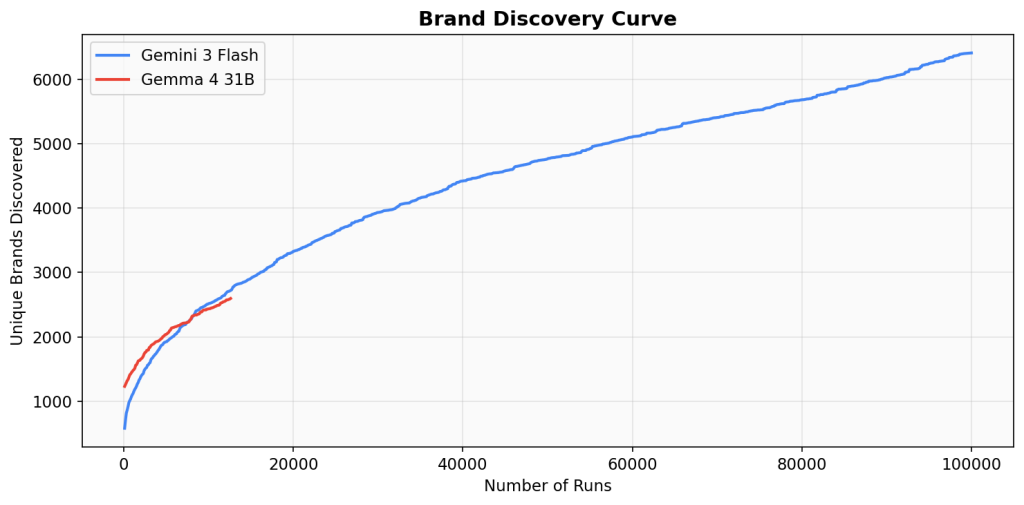
Both curves show the characteristic long-tail shape: rapid initial discovery followed by diminishing returns. Gemini’s curve continues to climb through 100,000 runs, suggesting Gemma 4 would similarly continue discovering new brands with more sampling.
Unique to Each Model
Of the top 50 brands in each model, 39 appear in both. The 11 unique to each side reveal a pattern:
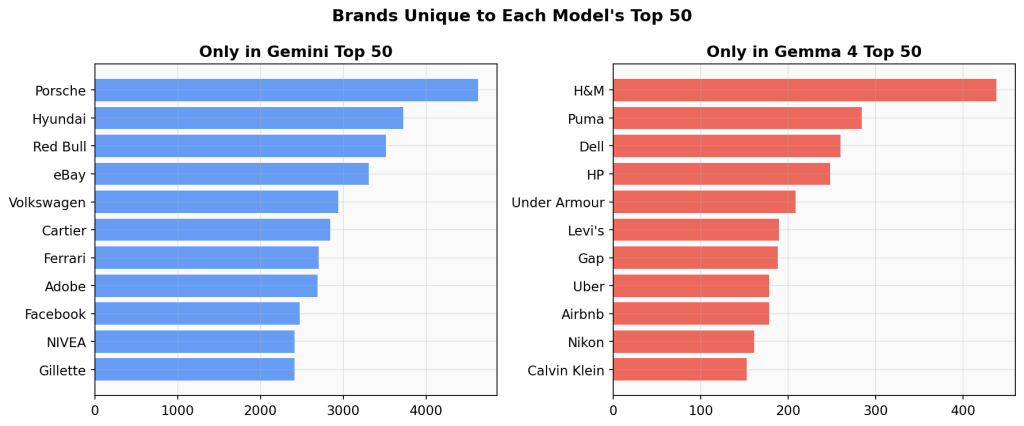
Only in Gemini’s top 50: Porsche, Hyundai, Red Bull, eBay, Volkswagen, Cartier, Ferrari, Adobe, Facebook, NIVEA, Gillette
Only in Gemma 4’s top 50: H&M, Puma, Dell, HP, Under Armour, Levi’s, Gap, Uber, Airbnb, Nikon, Calvin Klein
Gemini’s unique set skews luxury (Porsche, Ferrari, Cartier), European automotive (Volkswagen, Hyundai), and legacy tech/digital (eBay, Adobe, Facebook). Gemma 4’s unique set skews everyday retail (H&M, Gap, Levi’s), consumer electronics (Dell, HP, Nikon), and modern services (Uber, Airbnb).
Interpretation
What aligns
Both models share the same core set of mega-brands. Apple, Samsung, Toyota, Amazon, Microsoft, Adidas, Disney, Sony, Pepsi, BMW, and 28 others appear in both top-50 lists. The brand hierarchy is not random — it reflects genuine differences in brand salience as encoded in training data.
What diverges
The divergences cluster around three themes:
- Self-reference bias. Google ranks dramatically higher in its own proprietary model. This is the single largest rank shift in the dataset.
- Digital vs. physical. Gemini over-indexes on digital-native brands (Netflix, eBay, Adobe, Facebook). Gemma over-indexes on physical retail and consumer goods (H&M, Gap, Levi’s, Dell, HP).
- Luxury vs. everyday. Gemini remembers luxury brands more readily (Mercedes-Benz #10, Porsche, Ferrari, Cartier in top 50). Gemma favors mass-market brands (McDonald’s #6, Visa #15, Under Armour, Puma in top 50).
Possible explanations
- Training data composition. Gemma 4 may have a different distribution of training data, with more weight on consumer-facing web content versus Gemini’s potentially broader or more curated corpus.
- Model size. Gemma 4 31B is smaller than Gemini 3 Flash. Smaller models may default to more “obvious” or broadly recognized brands rather than luxury or niche ones.
- Alignment and tuning. Different RLHF/instruction tuning pipelines may influence which brands the model considers “representative” when asked for random examples.
What’s Next
This study covers Phase 1 only — the seed survey. The full authority map (Phases 2-3: association graph construction and PageRank computation) has not yet been run on Gemma 4 data. As rate limits allow, we plan to:
- Complete the 100,000-run target for statistical parity with the Gemini study
- Run the two-level association mapping on Gemma 4’s seed brands
- Compute Personalized PageRank to produce a full Gemma 4 Brand Authority Index
- Publish a direct comparison of the complete authority scores across both models
The raw data and code for this analysis are available on request.
Leave a Reply