Dan Petrovic ·
04 July 2016
Smartphones are no longer research-only devices, people use them to make transactions and buy things.

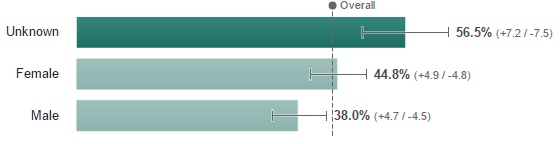
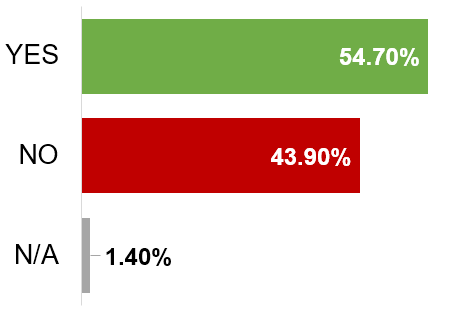 Our respondents (random gender, age, income and location distribution) answered an open-ended question by typing their response instead of selecting a preset answer. This has resulted in voluntary information including purchase frequency, types of items and other insights.
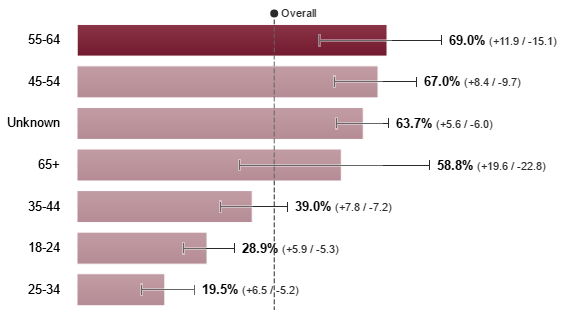
 Our data shows that younger generations have greater confidence in smartphone transactions. Among those aged between 35 and 44 a total of 38.4% haven't made a purchase on their mobile phone, while 25-34 age group shows only 19.7%. Despite the fact that young generations dominate mobile buying, it appears that very young Australians (18-24) don't trust buying via their smartphone as much as the 25-34 group. Unsurprisingly, ages 45+ top the chart with over half of the respondents in each group stating they've never made a purchase using their mobile phone.
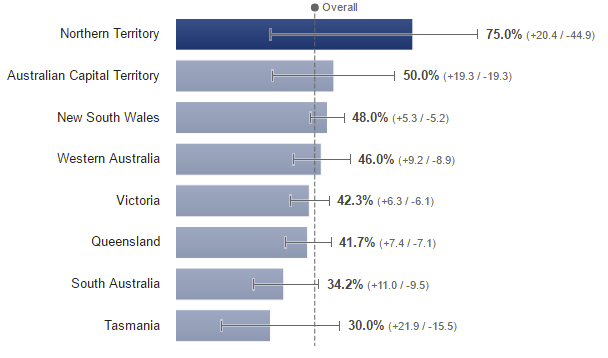
 Most of our Northern Territory respondents have never made an online purchase with their phone. Australian Capital Territory is in the second place with 50% hesitation rate. All other states show less than half of respondents against mobile buying with Tasmania being the clear early adopter.
 Some of our respondents have volunteered reasons for not buying on their mobile. One of the reasons was security, however qualitative study is required in order to determine the role of factors such as security and usability.
| Bounce Rate | Pages Per Session | Session Duration | Transactions | eCommerce Conversion Rate | Revenue | |
| Desktop | 35% | 5.95 | 0:05:40 | 10240 | 0.55% | $27,214,545.28 |
| Mobile | 55% | 3.75 | 0:03:04 | 2352 | 0.16% | $5,776,759.08 |
| Difference | 20% | 63% | 54% | 23% | 30% | 21% |
Data supplied by Conrad O'Connell from 91 Digital.
| Site #1 | ||||||
| Device Category | Bounce Rate | Pages / Session | Avg. Session Duration | Transactions | Revenue | Conversion Rate |
| desktop | 28% | 7.92 | 0:05:09 | 668 | $1,200,145.19 | 0.55% |
| mobile | 38% | 6.26 | 0:03:58 | 140 | $266,089.84 | 0.13% |
| tablet | 32% | 7.5 | 0:05:28 | 164 | $310,869.08 | 0.34% |
| 32% | 7.2 | 0:04:45 | 972 | $1,777,104.11 | 0.35% | |
| Site #2 | ||||||
| Device Category | Bounce Rate | Pages / Session | Avg. Session Duration | Transactions | Revenue | Conversion Rate |
| desktop | 31% | 7.6 | 0:07:38 | 3,337 | $10,329,930.87 | 1.02% |
| mobile | 52% | 7.9 | 0:03:57 | 727 | $2,044,227.56 | 0.28% |
| tablet | 40% | 8.32 | 0:07:17 | 671 | $2,090,157.23 | 0.59% |
| 40% | 7.83 | 0:06:12 | 4,735 | $14,464,315.66 | 0.67% | |
| Site #3 | ||||||
| Device Category | Bounce Rate | Pages / Session | Avg. Session Duration | Transactions | Revenue | Conversion Rate |
| desktop | 27% | 6.57 | 0:06:35 | 600 | $1,597,998.03 | 0.36% |
| mobile | 46% | 3.65 | 0:03:46 | 125 | $300,741.83 | 0.09% |
| tablet | 35% | 5.31 | 0:06:16 | 115 | $297,186.56 | 0.19% |
| 36% | 5.24 | 0:05:27 | 840 | $2,195,926.42 | 0.22% | |
| Site #4 | ||||||
| Device Category | Bounce Rate | Pages / Session | Avg. Session Duration | Transactions | Revenue | Conversion Rate |
| desktop | 34% | 5.65 | 0:04:15 | 210 | $863,117.76 | 0.20% |
| mobile | 84% | 1.5 | 0:01:12 | 54 | $191,214.12 | <0.01% |
| tablet | 71% | 2.42 | 0:02:09 | 55 | $251,693.87 | 0.04% |
| 75% | 2.17 | 0:01:44 | 319 | $1,306,025.75 | 0.04% | |
| Site #5 | ||||||
| Device Category | Bounce Rate | Pages / Session | Avg. Session Duration | Transactions | Revenue | Conversion Rate |
| desktop | 32% | 5.13 | 0:07:21 | 925 | $2,675,447.11 | 0.46% |
| mobile | 53% | 2.63 | 0:03:00 | 165 | $387,747.34 | 0.17% |
| tablet | 46% | 3.2 | 0:04:44 | 199 | $509,655.17 | 0.31% |
| 40% | 4.13 | 0:05:44 | 1,289 | $3,572,849.62 | 0.36% | |
| Site #6 | ||||||
| Device Category | Bounce Rate | Pages / Session | Avg. Session Duration | Transactions | Revenue | Conversion Rate |
| desktop | 45% | 3.85 | 0:03:52 | 217 | $539,502.02 | 0.33% |
| mobile | 51% | 2.71 | 0:02:45 | 37 | $80,254.17 | 0.10% |
| tablet | 49% | 3.33 | 0:04:04 | 53 | $131,349.73 | 0.22% |
| 48% | 3.41 | 0:03:34 | 307 | $751,105.92 | 0.24% | |
| Site #7 | ||||||
| Device Category | Bounce Rate | Pages / Session | Avg. Session Duration | Transactions | Revenue | Conversion Rate |
| desktop | 48% | 3.68 | 0:03:59 | 260 | $771,309.83 | 0.62% |
| mobile | 68% | 1.88 | 0:01:48 | 42 | $136,848.72 | 0.11% |
| tablet | 54% | 3.04 | 0:04:05 | 30 | $88,037.82 | 0.25% |
| 57% | 2.85 | 0:03:06 | 332 | $996,196.37 | 0.36% | |
| Site #8 | ||||||
| Device Category | Bounce Rate | Pages / Session | Avg. Session Duration | Transactions | Revenue | Conversion Rate |
| desktop | 32% | 6.85 | 0:05:51 | 418 | $1,002,520.25 | 0.47% |
| mobile | 50% | 4.02 | 0:03:36 | 97 | $218,244.90 | 0.12% |
| tablet | 37% | 6.5 | 0:06:11 | 112 | $253,688.85 | 0.35% |
| 40% | 5.69 | 0:05:01 | 627 | $1,474,454.00 | 0.31% | |
| Site #9 | ||||||
| Device Category | Bounce Rate | Pages / Session | Avg. Session Duration | Transactions | Revenue | Conversion Rate |
| desktop | 40% | 4.88 | 0:04:55 | 1,530 | $1,463,423.18 | 0.89% |
| mobile | 57% | 3.13 | 0:03:02 | 390 | $324,600.31 | 0.26% |
| tablet | 49% | 4.09 | 0:04:44 | 276 | $244,036.19 | 0.58% |
| 48% | 4.08 | 0:04:09 | 2,196 | $2,032,059.68 | 0.60% | |
| Site #10 | ||||||
| Device Category | Bounce Rate | Pages / Session | Avg. Session Duration | Transactions | Revenue | Conversion Rate |
| desktop | 32% | 7.36 | 0:07:06 | 2,075 | $6,771,151.04 | 0.58% |
| mobile | 54% | 3.82 | 0:03:38 | 575 | $1,826,790.29 | 0.21% |
| tablet | 41% | 5.66 | 0:06:18 | 509 | $1,664,383.40 | 0.44% |
| 42% | 5.79 | 0:05:42 | 3,159 | $10,262,324.73 | 0.42% |