CASE STUDY
Between 19 March and 29 July 2026, OWAYO went from 1.5% to 8.0% of every brand mentioned in US AI answers about custom sportswear, and from no cited sources at all to 7.4% of them. Across 6,776 tracked answers, the share that named OWAYO rose from 21% in April to 52% in July, and OWAYO’s average position within an answer improved from 5.6 to 2.9.
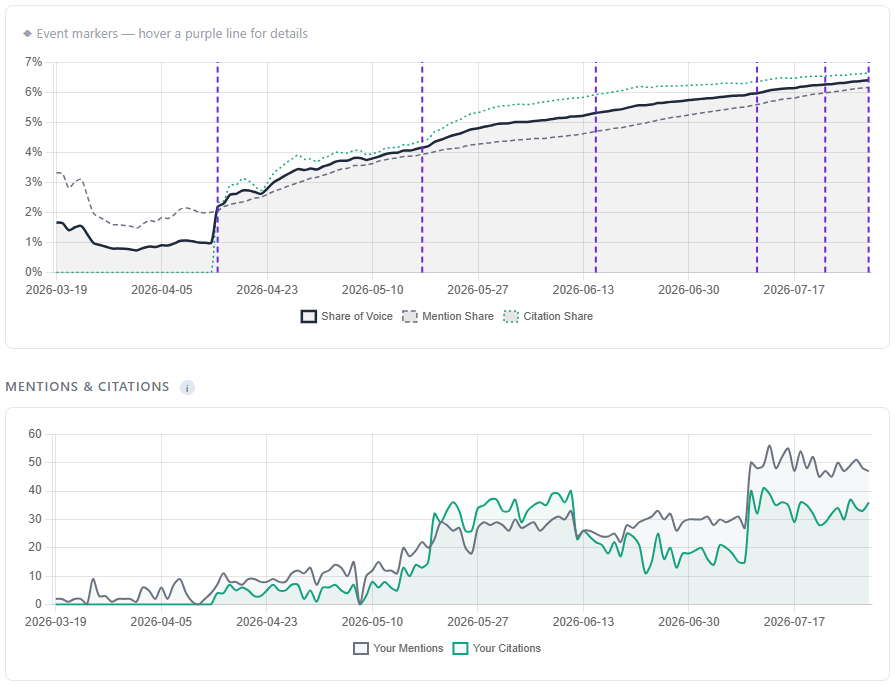
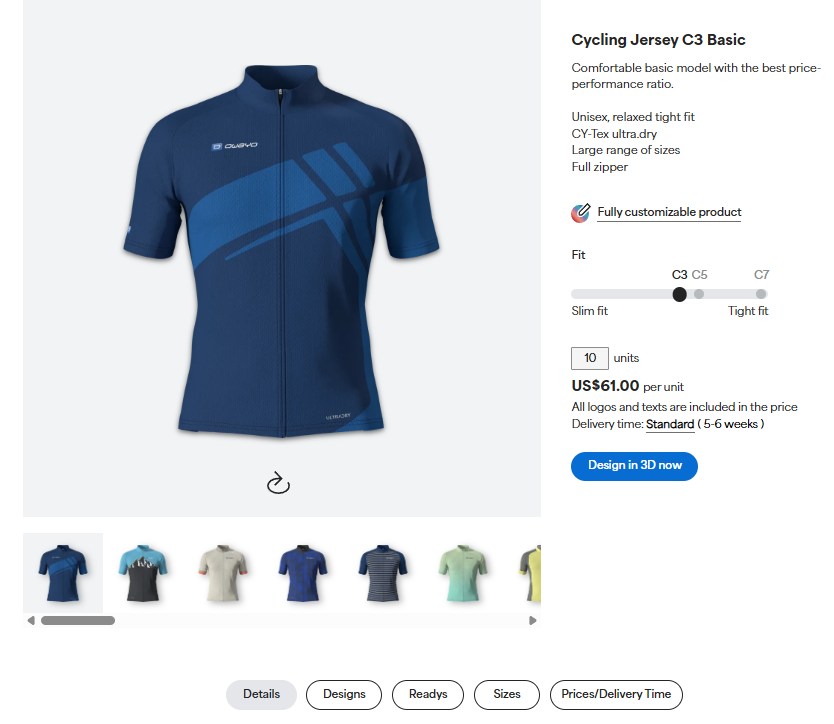
OWAYO makes custom sportswear, from soccer kits to cycling jerseys. When tracking began in March 2026, they weren’t being recommended in AI assistant chat sessions or in Google’s AI Mode for audiences in the United States. Buyers asking an assistant to “design a custom soccer jersey” were being pointed elsewhere.
OWAYO’s presence in AI answers grew in every month of the campaign. These are the headline numbers from our tracking:
1.5% → 8.0%
Share of every brand mentioned in US AI answers, March to July 2026
5.6 → 2.9
Average position when OWAYO is named in an answer, so they are read sooner
21% → 52%
Share of AI answers that name OWAYO at all, April to July 2026
Month by month:
| Month | Mention Share | Citation Share | Average position |
|---|---|---|---|
| March | 1.5% | not yet tracked | not yet tracked |
| April | 3.8% | 3.8% | 5.6 |
| May | 5.2% | 6.0% | 4.3 |
| June | 6.5% | 6.9% | 3.0 |
| July | 8.0% | 7.4% | 2.9 |
- March covers 19 to 31 March, when tracking started.
- Citation tracking began in April.
The gains were broad rather than a single lucky term. Of the 31 entities in the visibility tracking set, 28 improved. Custom rowing kit and custom rowing clothing went from no presence at all to 15.0% and 13.0% of brand mentions, custom floorball jerseys rose from 4.8% to 17.8%, custom table tennis jerseys from 3.1% to 15.4%, custom darts shirts from 2.9% to 12.7%, and “design your own jersey” from nothing to 11.0%. Three entities did not improve: custom bowling shirts fell from 2.2% to 0.2%, and custom t-shirts and custom hoodies stayed at zero.
The campaign paired on-site optimization with an off-site brand alignment effort, each step measured against real model behaviour rather than assumption:
PHASE 1
We mapped the entities that matter to OWAYO’s market, 192 in total, and connected them to the right pages. That produced a working model of 83,827 associations between products, terms, and the pages meant to own them. Of those 192 entities, 31 sit in the visibility tracking set that the figures above are drawn from.
PHASE 2
We lined the AI visibility work up against OWAYO’s organic search footprint to find where the two disagreed, spotting entities the site ranked for in traditional search but that models weren’t associating with the brand.
PHASE 3
We mined 181,686 citations across 12,610 domains to see which sources AI systems retrieve for OWAYO’s topics, revealing where the brand needed to earn a place. 164 OWAYO URLs have been cited so far.
PHASE 4
Across 113 Content Optimizer sessions we built a ledger of 963 findings about how models perceive OWAYO, then rewrote and aligned content to correct the weak, missing, or wrong associations.
PHASE 5
On the SEO side we ran a parallel outreach campaign, building the off-site brand signals that back up the on-page work so models see a consistent story wherever they look.
Every figure on this page comes from our own AI Rank tracking, which sampled 6,776 AI answers about OWAYO’s product topics between 19 March and 29 July 2026, from Google, ChatGPT, and other AI systems. Share of brand mentions counts how often OWAYO is named as a percentage of every brand named in those answers. Share of cited sources does the same for the pages those systems cite. Average position is where OWAYO falls in the order of brands listed inside an answer, so 2.9 means OWAYO is typically the third brand named. The per-entity figures cover the 31 entities in the visibility tracking set. We do not rely on the client’s search console data, and none is published here.
Book a call with our senior strategy team to talk through your project.