 Dan Petrovic ·
14 October 2026
Release-day tests on Gemini 4 Argon: it punishes hype and still wants hard facts like prices, but tables, a favourite of every Flash model, fall from 93.6% to 31.5%.
TL;DR. Google released Gemini 4 Argon today, and it is already live in AI Mode. On release day we ran 5,381 head-to-head tests to see which version of a web page Argon picks as a source. Argon reads like a sceptical buyer. It punishes hype: exclamation marks and all-caps words lost all 150 of their tests. It still wants hard facts: pages with clear prices won 99.7% of theirs. It is much less impressed by packaging than Gemini 3.8 Flash. The biggest surprise is table format: a favourite of every Flash model, it won 93.6% of its tests on 3.8 Flash and 31.5% on Argon. To see how Argon reads your own pages, run your domain through app.dejan.ai/argon/.
We take a short commercial web page and make a copy with one change, such as adding prices or adding exclamation marks. Argon sees both versions and picks the one it would use as a grounding source to answer a chat query. We swap which version comes first from pair to pair, and each feature gets about 150 tests. We ran the same tests earlier on Gemini 3.6, 3.7 and 3.8 Flash, so every Argon number has a Flash number beside it. The method and its checks are described in our earlier Rank Signal post.
We call these features rank factors, and the name trips people up. Many readers take it to mean search ranking factors, the signals a search engine uses to order its results. Here it means something else. When an AI system answers with live search, it first retrieves a set of candidate pages, and then a language model reads the candidates side by side and decides which ones to use. That second step is a ranking done by the model itself, known as in-context ranking or generative reranking. It is a different process from generative self-retrieval, where a model recalls facts from its own weights instead of choosing between pages it was given. A rank factor is a feature of a page's text that moves the model's choice at that step, the layer we call secondary bias. A page's search position decides whether it reaches the candidate set, and its rank factors decide what happens once it is there. The outcome is measured as selection rate, not search position.
We name seven of the 36 features here and describe the rest by type. app.dejan.ai/argon/ runs the full Argon comparison on your own domain.
Exclamation marks and all-caps words lost every one of their 150 tests on Argon. A third hype feature won none of its 148. All three were already close to zero on every Flash model, so Argon kept this trait from the Flash line.
Pages with clear prices won 99.7% of their tests, the strongest result of any feature on Argon. A second factual feature won 91.1%.
Argon differs most from Flash on formatting, and table format shows the largest change of any feature. Tables won 85.9% of their tests on 3.6 Flash, 86.1% on 3.7 Flash and 93.6% on 3.8 Flash. On Argon they win 31.5%, so a page that adds a table now loses about two tests in three.
Three more formatting features fall with it, by 44 to 50 points each. Headed sections held up better, at 91.1% on Argon against 99.5% on 3.8 Flash.
Two features that lean on outside authority fall by about 35 points each. Both had climbed with every Flash generation, one from 70.3% on 3.6 Flash to 93.6% on 3.8 Flash and the other from 49.3% to 81.7%. On Argon they sit at 57.9% and 46.7%, close to where 3.6 Flash had them. Our Content Optimization Engine found the same direction on live client pages: across 2,249 experiments, credential edits such as awards, expert endorsements and citations won 15.4% of the time, the lowest of any group.
Between 3.6 and 3.8 Flash, Gemini turned against a group of tone features. Inclusive framing fell from 48.9% to 13.4%, and three other tone features fell below 8%. Argon stays within noise of 3.8 Flash on all four. Sustainability claims win 33.4% of tests on Argon and 28.2% on 3.8 Flash.
Each dot is one feature. A dot on the diagonal wins the same share of tests on both models, and a dot below it wins less often on Argon. Red marks a fall larger than the margin of error, blue a rise larger than the margin, and grey a change within noise.
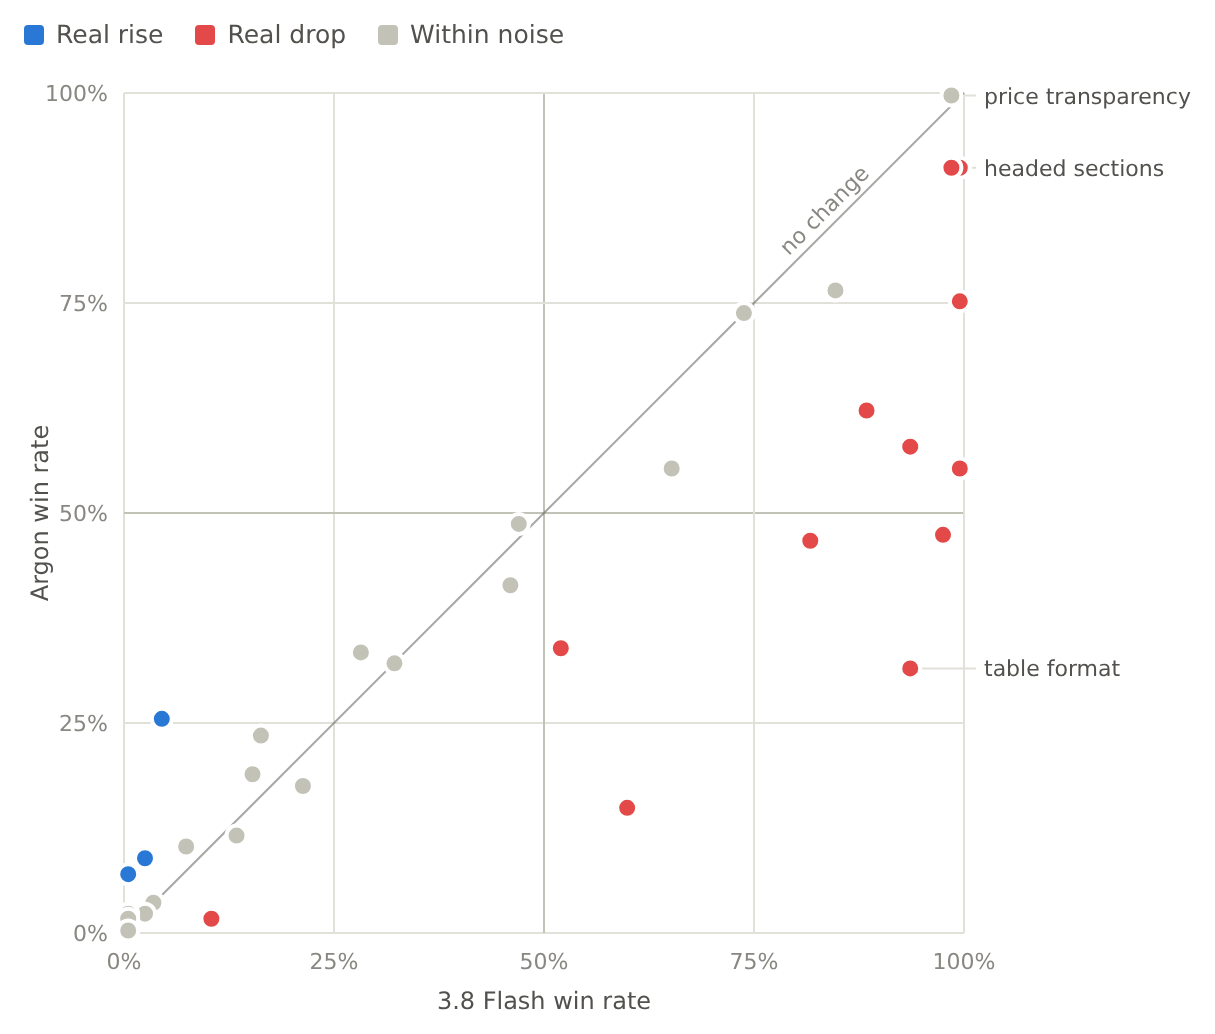
15 of the 36 features shift by more than the margin: 12 fall and 3 rise. Most of the falls sit in the top right: 9 of the 12 are features that won more than 80% on 3.8 Flash. Of the 19 features below 35% on 3.8 Flash, all except one framing feature stay within 9 points of their Flash rate.
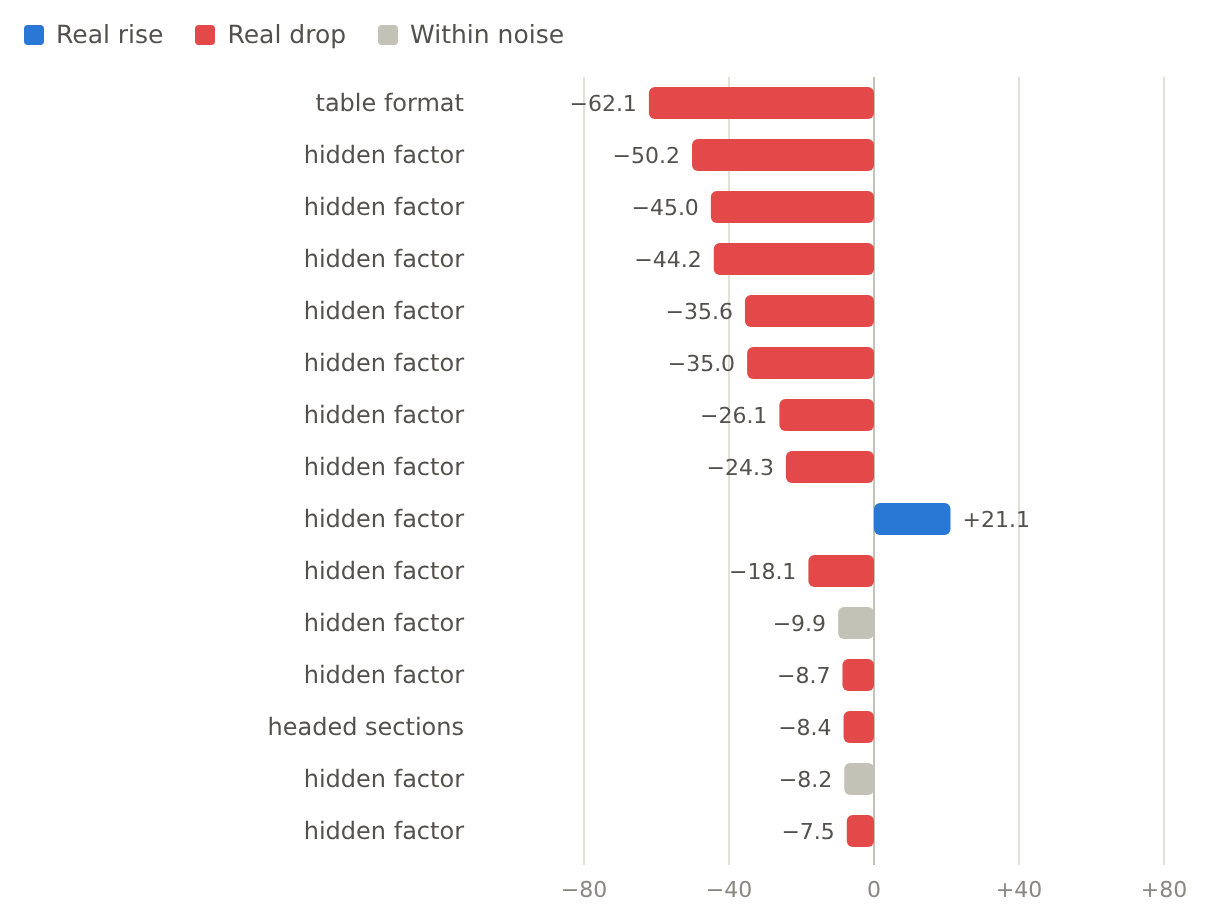
Grouped by type, using the average win rate of the features in each group:
| Group | Features | 3.8 Flash | Argon | Change |
|---|---|---|---|---|
| Table format | 1 | 93.6% | 31.5% | -62.1 |
| Other formatting | 3 | 85.6% | 39.2% | -46.4 |
| Borrowed credibility | 2 | 87.7% | 52.3% | -35.4 |
| Hard facts | 2 | 98.5% | 95.4% | -3.1 |
| Tone | 4 | 6.7% | 7.0% | +0.3 |
| Hype | 3 | 0.5% | 0.3% | -0.2 |
The largest rise is a framing feature, from 4.5% to 25.5%. It still hurts on Argon: pages that carry it lose three tests in four instead of 19 in 20.
Stage 1 measures what one feature does to an average page. Validate asks a harder question: take a page that loses to a rival page Argon wrote, add one feature, and check whether the loss turns into a win. Two Validate runs on Argon on 14 October 2026 gave seven features 11 such tests each, for $2.86.
| Feature | Losing pages turned into wins |
|---|---|
| The second factual feature | 10 of 11 |
| An explanatory feature | 9 of 11 |
| A borrowed credibility feature | 8 of 11 |
| A narrative feature | 6 of 11 |
| A local feature | 6 of 11 |
| A formatting feature | 5 of 11 |
| A tone feature | 0 of 11 |
Six of the seven clear the tool's validation bar of at least 10 tests and at least 30% of losses turned. Two results run against Stage 1. The formatting feature wins 14.9% of Stage 1 tests on Argon and still turned 5 of 11 losing pages into wins, and the credibility feature turned 8 of 11 after falling 35.6 points in Stage 1. The Content Optimization Engine saw the same split on client pages: the two factors that lifted pages most often also appeared among those that pushed pages down in other competitive sets, so every edit has to be tested on the page it is meant for.
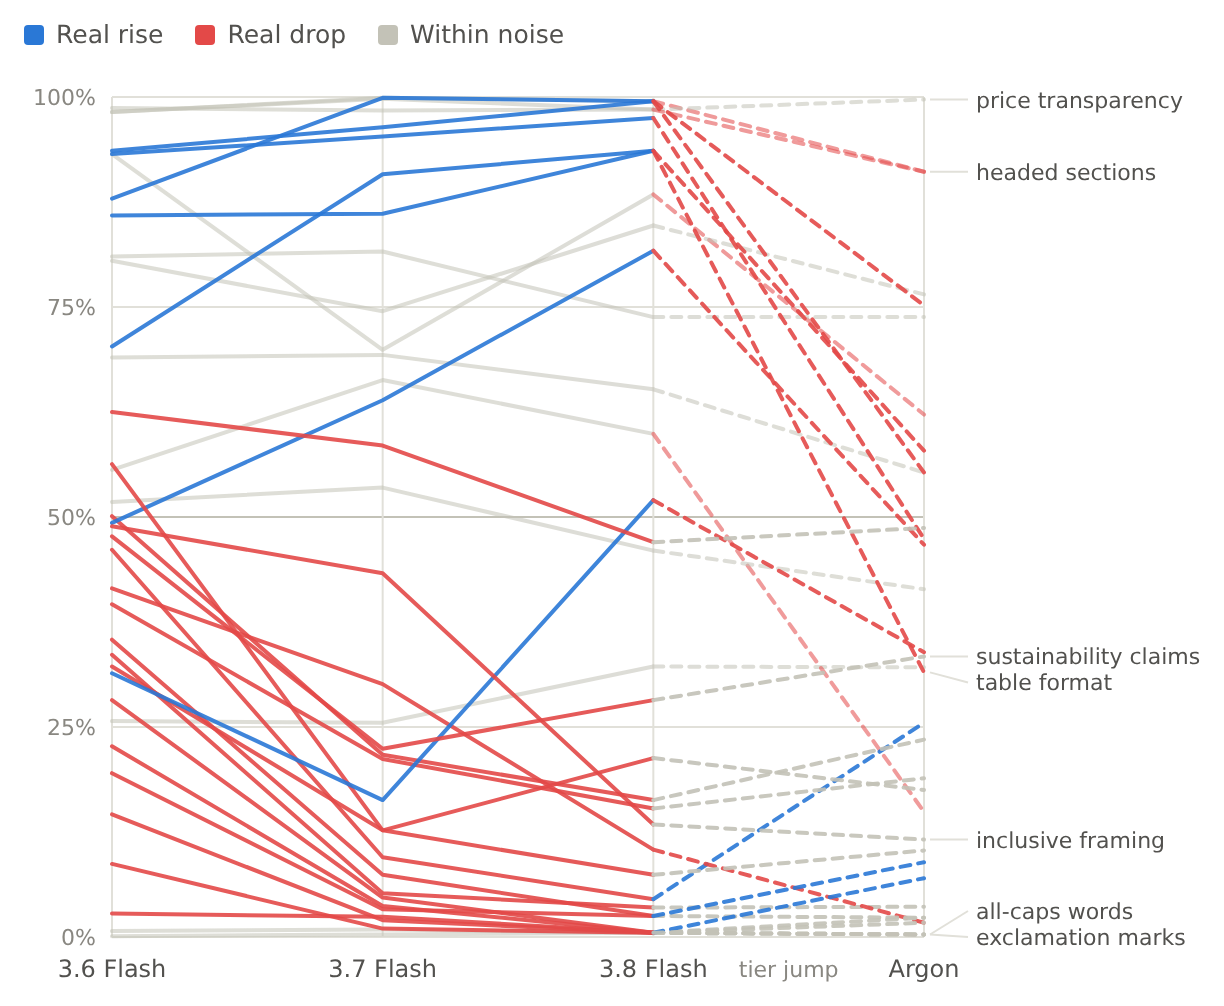
The slope chart follows each feature through 3.6, 3.7 and 3.8 Flash. The last step goes to Argon, which is a different tier, so that step is drawn dashed. From 3.6 to 3.8 Flash, 24 of the 36 features shifted by more than the margin, 17 of them down.
Every feature on every model, sorted by average win rate. Blue cells win more often than a coin flip, red cells lose more often, and grey cells sit close to 50%. Seven features are named: table format, plus two from the top, two from the middle and two from the bottom.
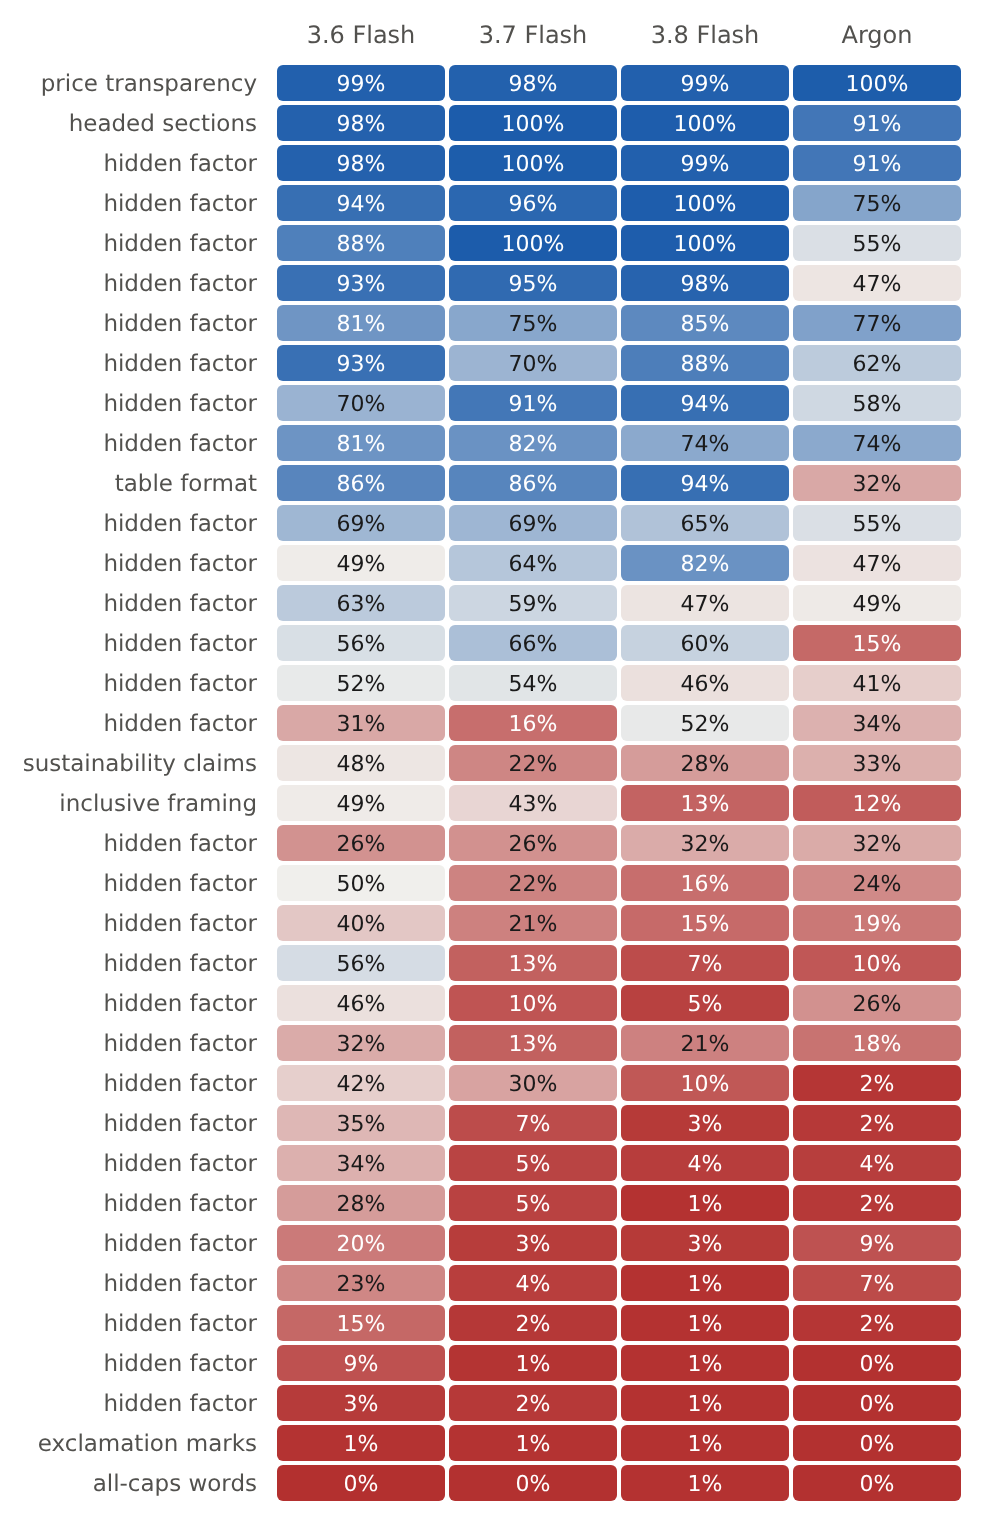
| Feature | 3.6 Flash | 3.7 Flash | 3.8 Flash | Argon |
|---|---|---|---|---|
| Price transparency | 98.7% | 98.4% | 98.5% | 99.7% |
| Headed sections | 98.2% | 99.9% | 99.5% | 91.1% |
| Table format | 85.9% | 86.1% | 93.6% | 31.5% |
| Sustainability claims | 47.7% | 22.4% | 28.2% | 33.4% |
| Inclusive framing | 48.9% | 43.3% | 13.4% | 11.6% |
| Exclamation marks | 0.7% | 0.9% | 0.5% | 0.3% |
| All-caps words | 0.1% | 0.3% | 0.5% | 0.3% |
Google published the Gemini 4 Argon model card on 13 October 2026.
The Argon data comes from six runs on 13 October 2026: 145 to 150 tests per feature on 180 base pages, for $59.63. 3.8 Flash has 98 to 100 tests per feature, 3.7 Flash about 500 and 3.6 Flash about 700. One model fills every role in a run: it writes the base pages, applies the one-feature edit and casts the vote. Argon's pairs are pages Argon wrote, so each model is measured on its own material.
Win rates are the mean of a Jeffreys posterior, which is why 0 wins out of 150 reads as 0.3%. A change counts as real when it is larger than 1.96 times the combined standard error of the two rates. With 100 tests on one side and 150 on the other, that margin runs from ±1.7 points for features near 0% or 100% to ±12.6 points for features near 50%. Argon picked the version it read first in 56.6% of tests, against 51.4% for 3.8 Flash and 69.0% for 3.6 Flash.
The test asks Argon to choose a grounding source for a simulated chat query. It does not observe AI Mode's live citations. The pages are synthetic commercial copy, and what is measured is selection, not ranking or traffic. The Validate figures come from two runs with 11 tests per feature, and we will add to them as the runs continue.
The tests above use synthetic pages. To see how Argon behaves on real search results, we took a custom sportswear brand that runs Content Optimization Engine experiments with us and re-ran the first step of all 89 of its snippet experiments on both models. That step is the baseline: the model ranks the brand's search snippet against its competitors' snippets for one query, before any edit is made. Each model ranked every set three times. The brand's average position came out the same, 3.80 on 3.8 Flash and 3.81 on Argon, while Argon cost 3.1 times as much per ranking and took 1.8 times as long.

The two models spread the brand differently. Argon placed it first in 19 runs against 30 on Flash, and second in 22 runs against 16. Its positions are less spread out, and the average is the same.

Run by run, Argon placed the brand higher in 26 runs, Flash in 26, and both gave it the same position in 37. Their full rankings of all snippets agree closely, with a Kendall tau of 0.85, and both put the same snippet first in 65% of runs. Two queries moved by three places or more: "custom sportswear" and "custom eSports jerseys", where Flash ranked the brand first and Argon fourth.
| Measure | 3.8 Flash | Argon |
|---|---|---|
| Average position | 3.80 | 3.81 |
| Runs with the brand in first place | 30 (34%) | 19 (21%) |
| Runs where all three rankings gave the same position | 42% | 47% |
| Agreement between the three rankings (Kendall tau) | 0.86 | 0.87 |
| Same position as the original experiment | 60% | 52% |
| Tokens per ranking, in and out | 3,306 and 267 | 3,325 and 406 |
| Words of rationale per ranking | 156 | 279 |
| Time per ranking | 3.5 s | 6.2 s |
| Cost of 267 rankings | $1.86 | $5.72 |

Argon reads the same snippets for about the same input and writes a longer explanation of its ranking, 279 words against 156, at a higher price per token. That is where the extra cost and time come from.
Both models ran the optimizer's own ranking prompt at the low thinking level, with the snippets in a new random order for every ranking, 534 rankings in all, for $7.58. Costs use our app's rates: $1.50 and $7.50 per million input and output tokens for 3.8 Flash, $4 and $20 for Argon. The original experiments were ranked by Gemini 3.5, 3.7 and 3.8 Flash and an earlier Flash preview. The case covers one brand and one task, snippet ranking.