 Dan Petrovic ·
19 July 2026
Dan Petrovic ·
19 July 2026
This paper analyzes Engadget's article corpus from 2006 to 2023 using Shannon entropy and data compression to track editorial trends and article length.
This paper profiles Engadget's article corpus using nothing but Shannon entropy and data compression — no language model, no parser, no notion of words or topics. It opens with a data-quality result that the method delivers for free: the raw scrape of 13,147 pages is two populations, not one, and compression alone tells them apart. Roughly 60% of the pages are product-hub templates rather than articles, and removing them leaves 5,214 genuine articles spanning 2006–2023. On that cleaned corpus the measurements record a distinctive editorial arc — article length climbing to a mid-2010s long-form peak and then retreating, a compression signal that largely (but not entirely) shadows that length, and a symbol distribution that drifts only slightly across eighteen years. The figures are laid out plainly and in aggregate; the causes are left to the reader.
Six quantities are extracted per article. Five are stored directly; the sixth is derived across the corpus.
The engine has no linguistic knowledge; "vocabulary" and "phrasing" below are shorthand for these symbol-level statistics, not claims about words or grammar.
One caveat specific to this corpus. Engadget's scraped text retains a layer of site furniture — navigation strings, "Sponsored Links", byline and tag fragments, privacy-policy boilerplate. This furniture is fragmentary and compresses poorly, so Engadget's absolute bits/byte sit higher than a cleaner scrape would show. Absolute levels are therefore not comparable to other publishers; Engadget's own trends over time, measured against a roughly constant furniture overhead, are.
Before any editorial reading, the method flags a problem. Of 13,147 scraped pages, 7,933 (60%) are /products/ hub pages, not articles — product-database entries whose captured text is the site's generic news rail, identical from page to page, uniformly ~6,700 characters, and undated. The remaining 5,214 are genuine articles, essentially all dated.
Compression separates the two with almost no overlap:
| Population | Pages | Median bits/byte | Share above 3 bits/byte |
|---|---|---|---|
/products/ hub templates | 7,933 | ~2.25 | 7% |
| Genuine articles | 5,214 | 3.76 | 99.7% |
A single threshold at 3 bits/byte assigns 99.7% of articles to one side and 93% of template pages to the other — the compressor tells editorial prose from boilerplate without reading a word. The cost of ignoring the split is large: on the raw scrape, a length-normalized anomaly scan flags 48% of pages; on the cleaned corpus it flags 1.9%. The near-half "anomaly rate" was simply the two populations sitting on top of each other.
Everything below is computed on the cleaned corpus of 5,214 articles (/products/ pages excluded by URL — a metadata filter, consistent with the no-language method).
| Metric | Median | p25 | p75 |
|---|---|---|---|
| Order-0 entropy \(H_0\) | 4.523 | 4.474 | 4.599 |
| Order-1 entropy \(H_1\) | 3.394 | 3.299 | 3.463 |
| Redundancy \(R\) | 0.262 | 0.244 | 0.275 |
| Bits/byte (raw) | 3.758 | 3.553 | 4.031 |
| Length (chars) | 5,856 | 2,616 | 11,094 |
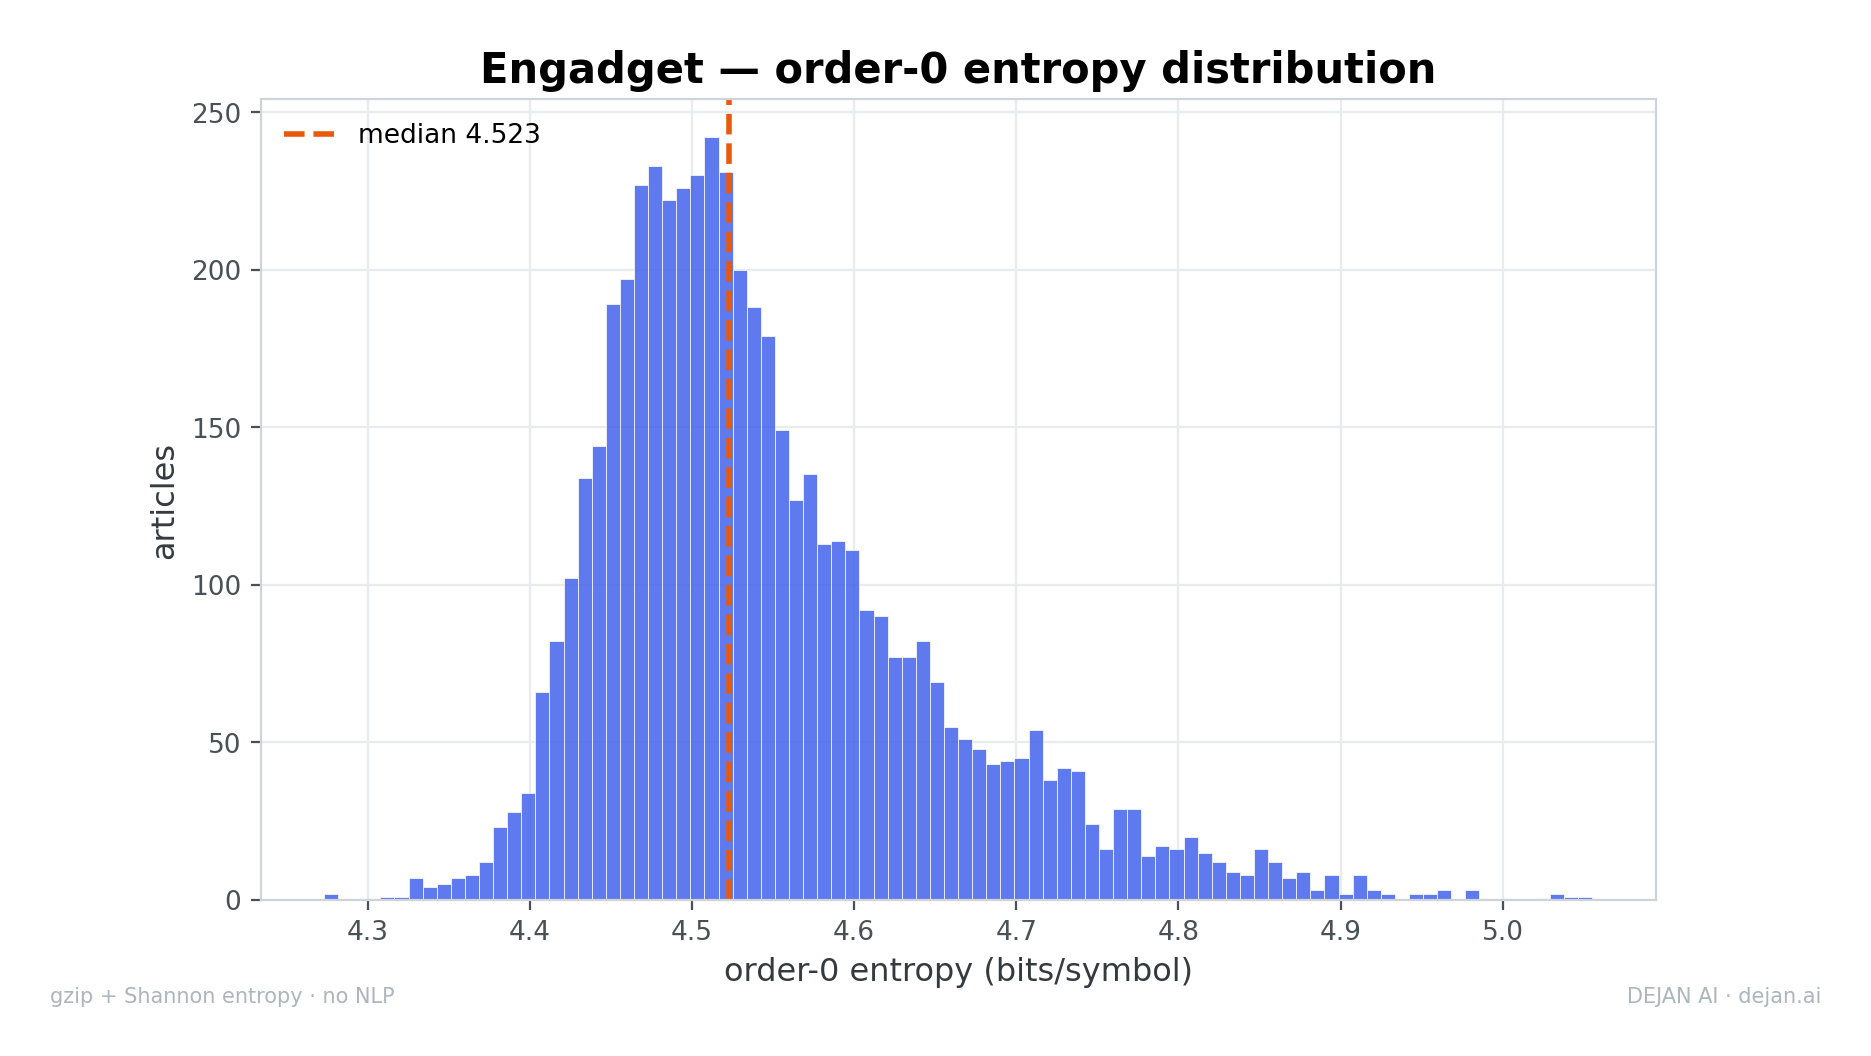
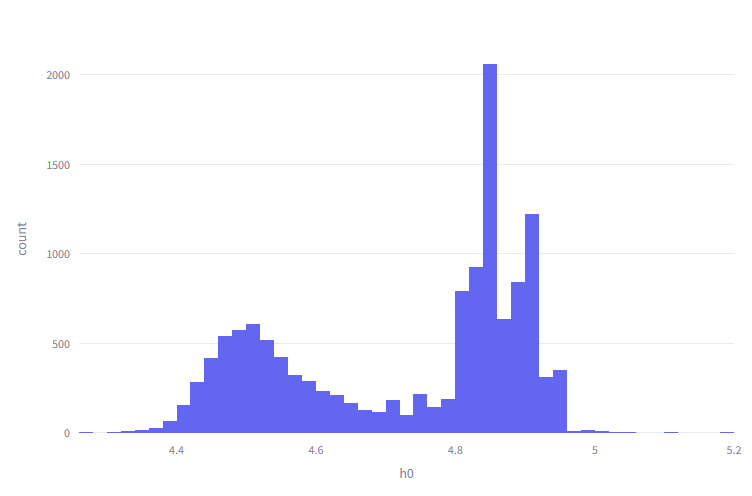
The distribution of order-0 entropy for Engadget articles forms a single, right-skewed peak with a median of 4.523.
The order-0 entropy distribution is a single, mildly right-skewed hump — the telltale second peak that appears on the raw scrape belongs to the template pages, and vanishes once they are removed.
The per-year medians across eighteen years:
| Year | n | \(H_0\) | \(H_1\) | \(R\) | bpb (raw) | \(\text{bpb}_{\text{adj}}\) | Length |
|---|---|---|---|---|---|---|---|
| 2006 | 97 | 4.608 | 3.276 | 0.225 | 4.525 | +0.129 | 1,614 |
| 2007 | 146 | 4.525 | 3.308 | 0.243 | 4.211 | +0.046 | 2,463 |
| 2008 | 233 | 4.633 | 3.195 | 0.212 | 4.648 | +0.065 | 1,242 |
| 2009 | 264 | 4.544 | 3.343 | 0.255 | 3.958 | +0.034 | 3,979 |
| 2010 | 448 | 4.520 | 3.389 | 0.265 | 3.777 | +0.029 | 6,262 |
| 2011 | 466 | 4.523 | 3.413 | 0.268 | 3.688 | +0.030 | 7,960 |
| 2012 | 553 | 4.537 | 3.420 | 0.264 | 3.668 | −0.010 | 7,504 |
| 2013 | 542 | 4.525 | 3.384 | 0.262 | 3.745 | −0.005 | 5,452 |
| 2014 | 906 | 4.491 | 3.336 | 0.257 | 3.871 | −0.031 | 3,396 |
| 2015 | 179 | 4.522 | 3.443 | 0.268 | 3.646 | −0.009 | 10,040 |
| 2016 | 153 | 4.539 | 3.461 | 0.271 | 3.606 | +0.022 | 10,284 |
| 2017 | 140 | 4.519 | 3.459 | 0.272 | 3.586 | −0.002 | 10,499 |
| 2018 | 201 | 4.518 | 3.449 | 0.270 | 3.638 | −0.000 | 9,470 |
| 2019 | 294 | 4.528 | 3.437 | 0.267 | 3.670 | +0.003 | 8,412 |
| 2020 | 269 | 4.526 | 3.443 | 0.271 | 3.574 | −0.035 | 9,325 |
| 2021 | 139 | 4.520 | 3.439 | 0.271 | 3.662 | −0.027 | 8,654 |
| 2022 | 45 | 4.530 | 3.373 | 0.259 | 3.718 | −0.040 | 4,166 |
| 2023 | 131 | 4.512 | 3.386 | 0.262 | 3.713 | −0.177 | 4,862 |
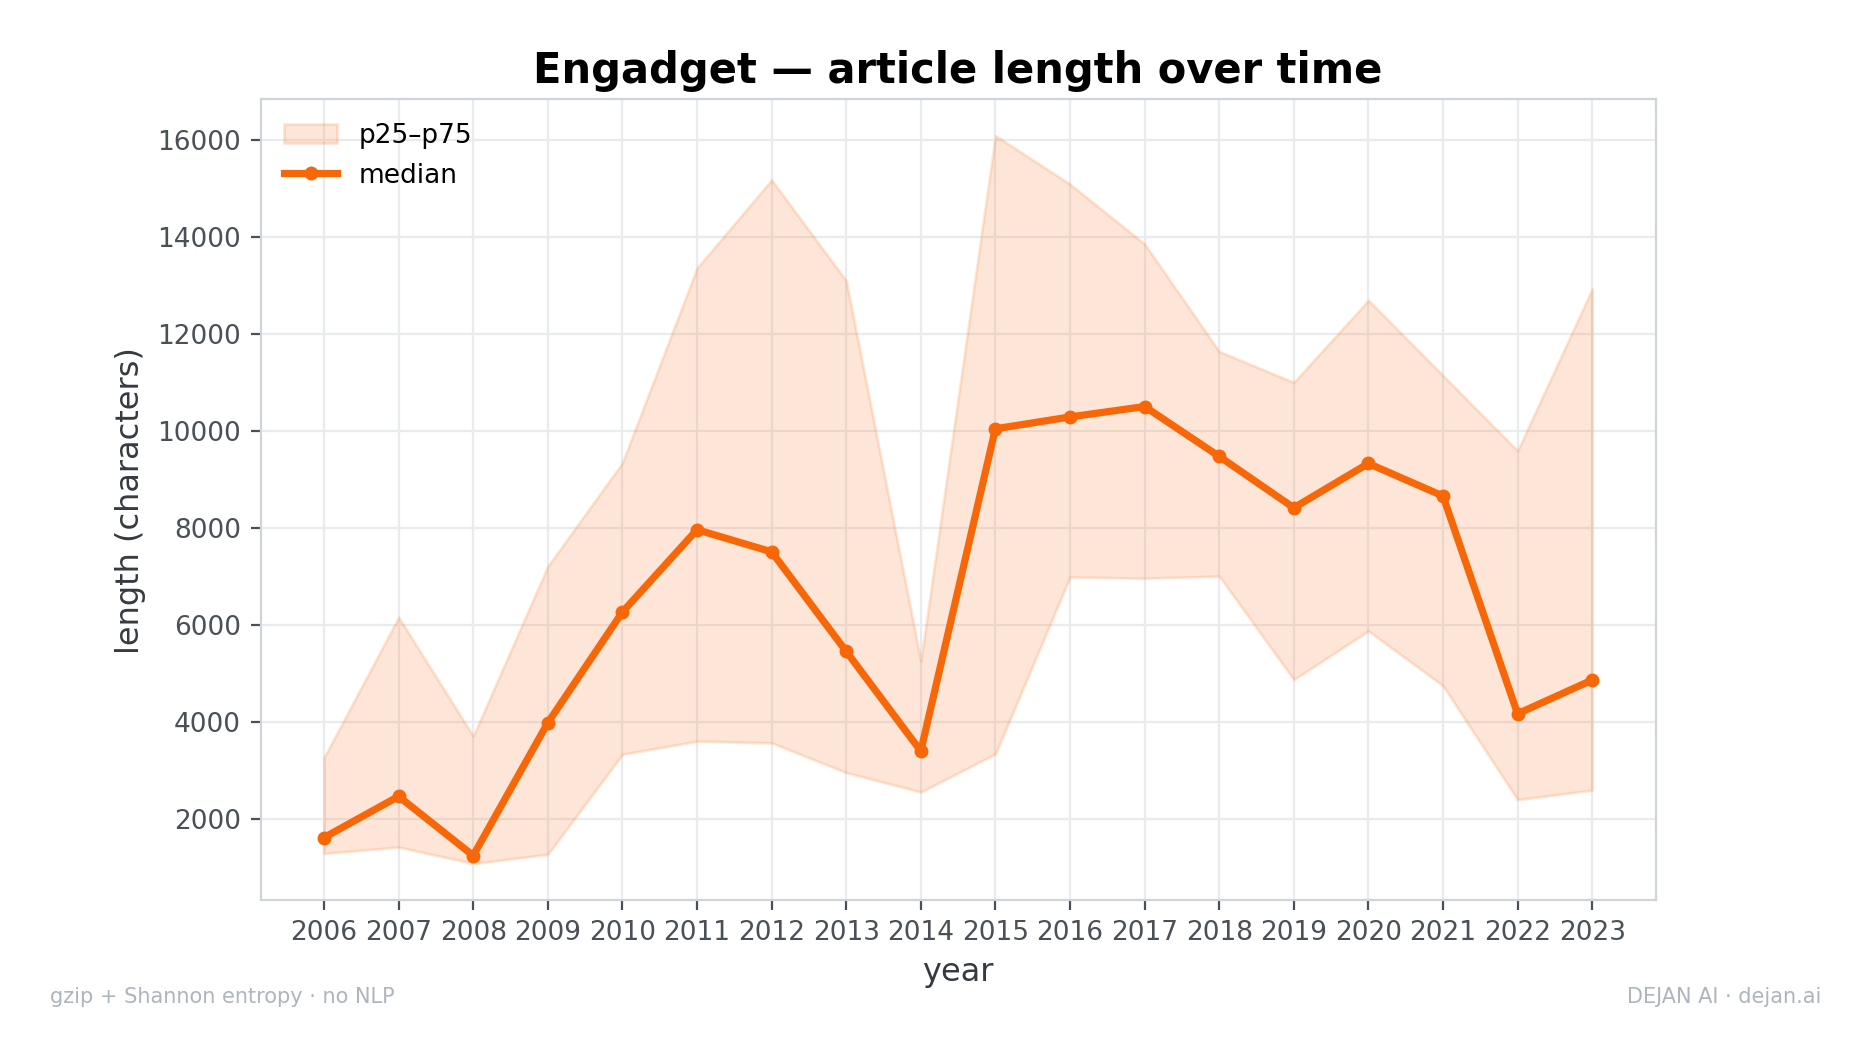
Line graph of Engadget article length from 2006 to 2023 shows median length peaking in the mid-2010s.
Engadget's length does not grow monotonically. From short posts in the mid-2000s (median 1,614 characters in 2006), it climbs to an early plateau around 2011 (8,000), dips sharply in 2014 (3,400, the year with the most articles in the corpus at 906), leaps to a long-form peak across 2015–2017 (~10,000–10,500), and then retreats through the early 2020s to ~4,200–4,900. The overall 2006-to-2023 change of +201% understates a fuller shape: Engadget lengthened into a mid-decade long-form era and then pulled back toward shorter pieces.
The spread is wide throughout — in 2017 the middle half of articles ran from 6,959 to 13,851 characters — and the article count itself swings (906 in 2014, 45 in 2022), so length and volume move together in places worth noting rather than smoothing over.
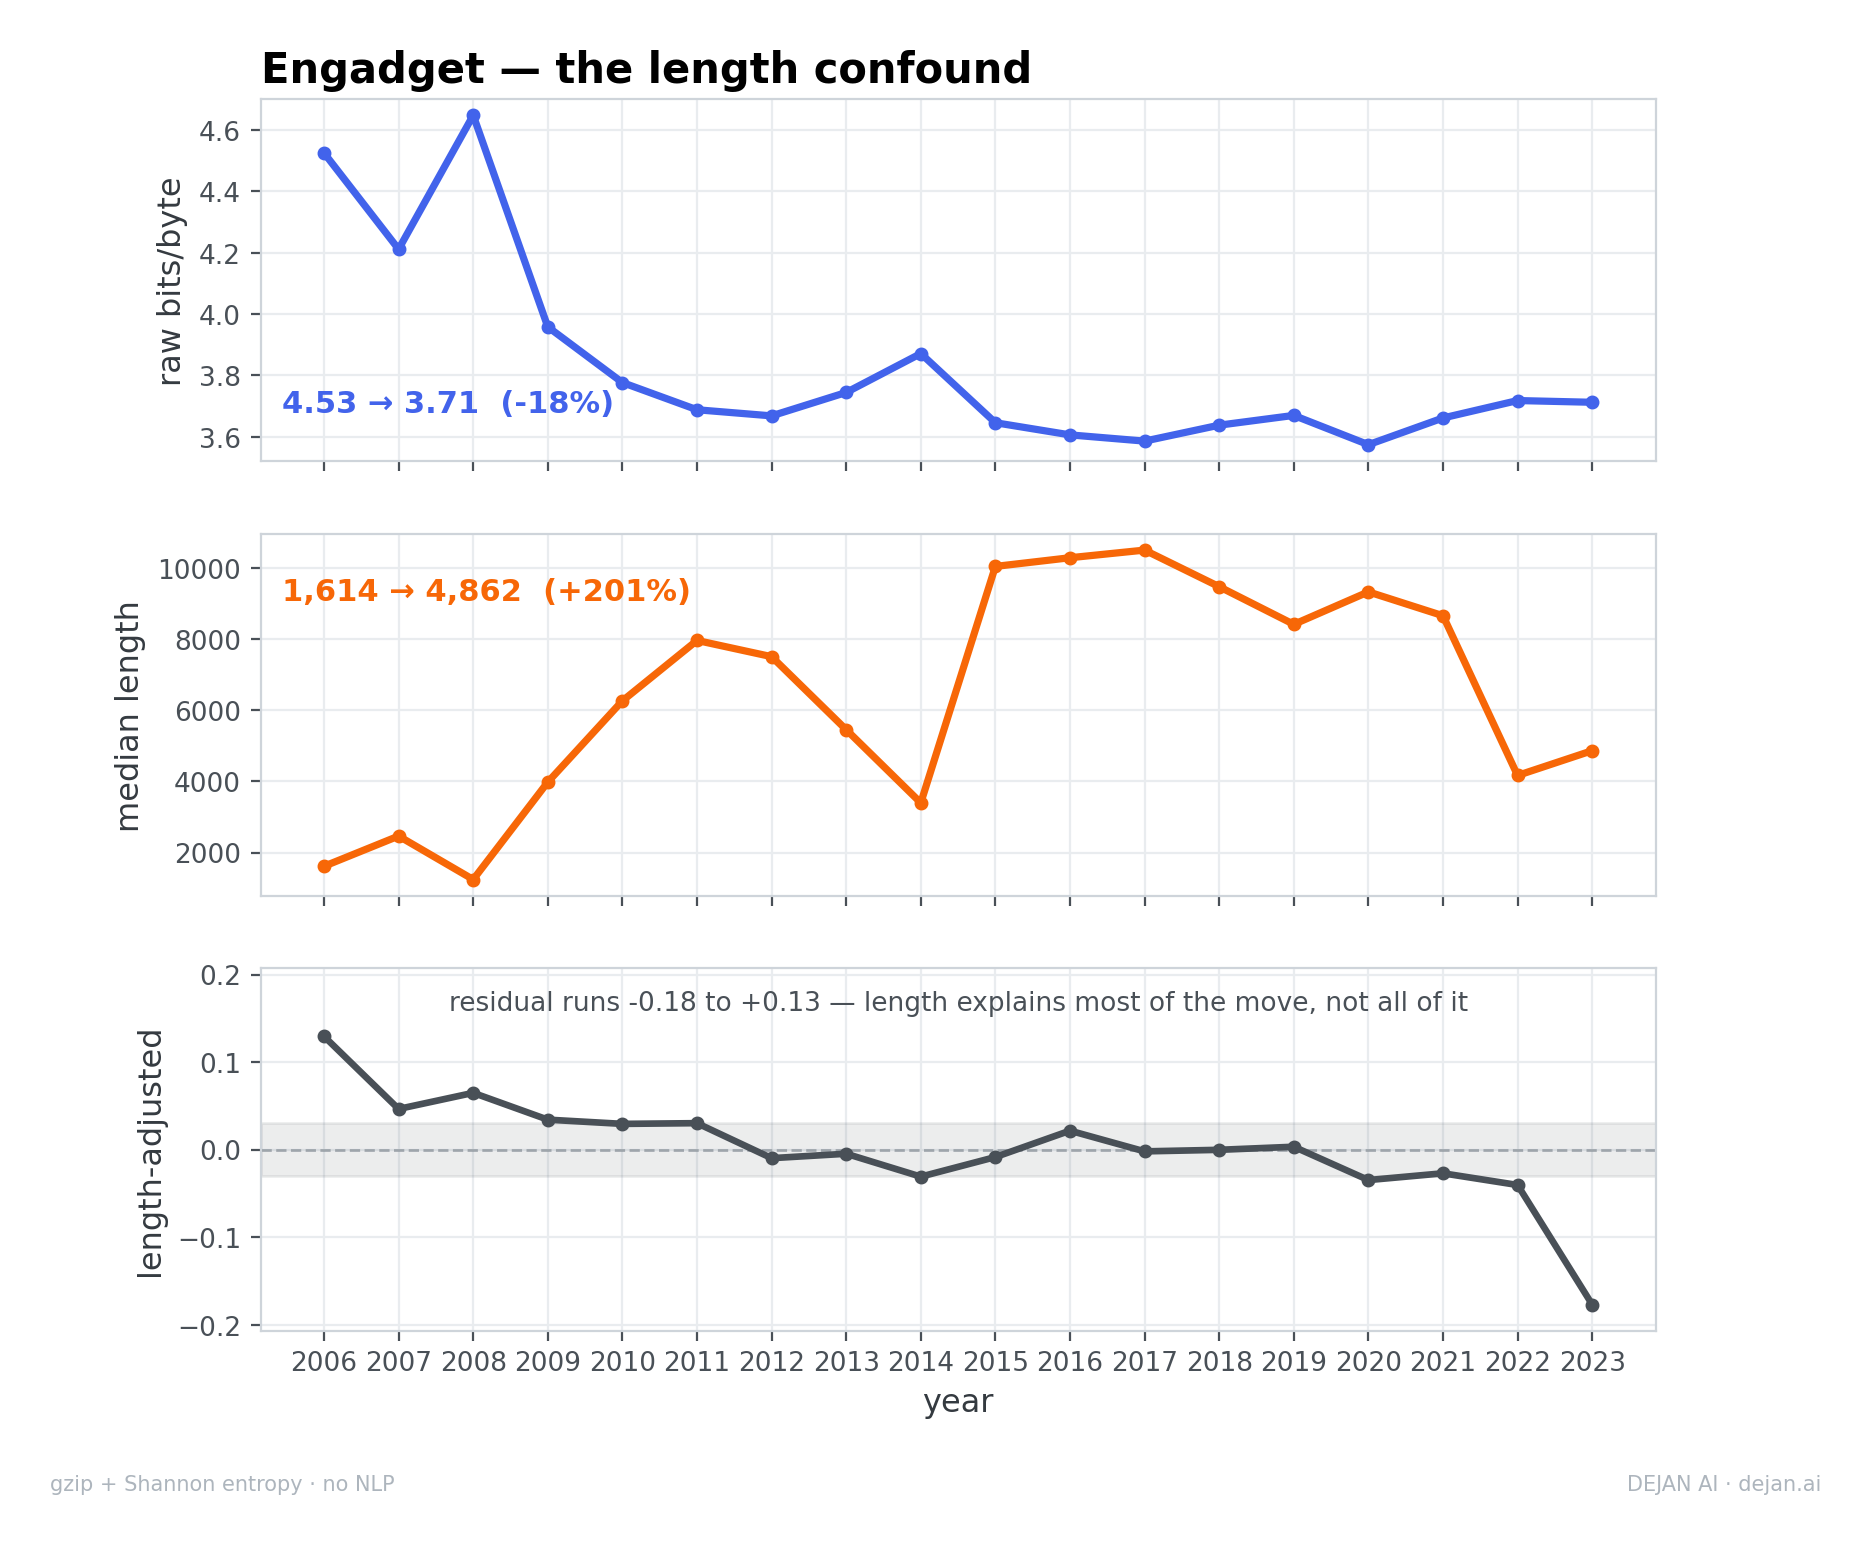
Three line graphs show raw compressibility mirroring median article length over time, with a declining length-adjusted trend.
Raw bits/byte moves as a rough mirror of length, falling from ~4.5 in the short mid-2000s to ~3.6–3.7 once articles lengthen (−18% end to end). The link is strong:
But length does not account for all of it. When the length effect is divided out, the residual \(\text{bpb}_{\text{adj}}\) is not flat: it runs from +0.13 in 2006 to −0.18 in 2023. Early articles were slightly less compressible than their length predicted; recent ones — 2023 most sharply — are more compressible than their length predicts. So Engadget's compression trend is mostly length, with a real length- independent drift on top. (That drift could reflect changing prose, changing amounts of site furniture across redesigns, or both; the method cannot separate them.)
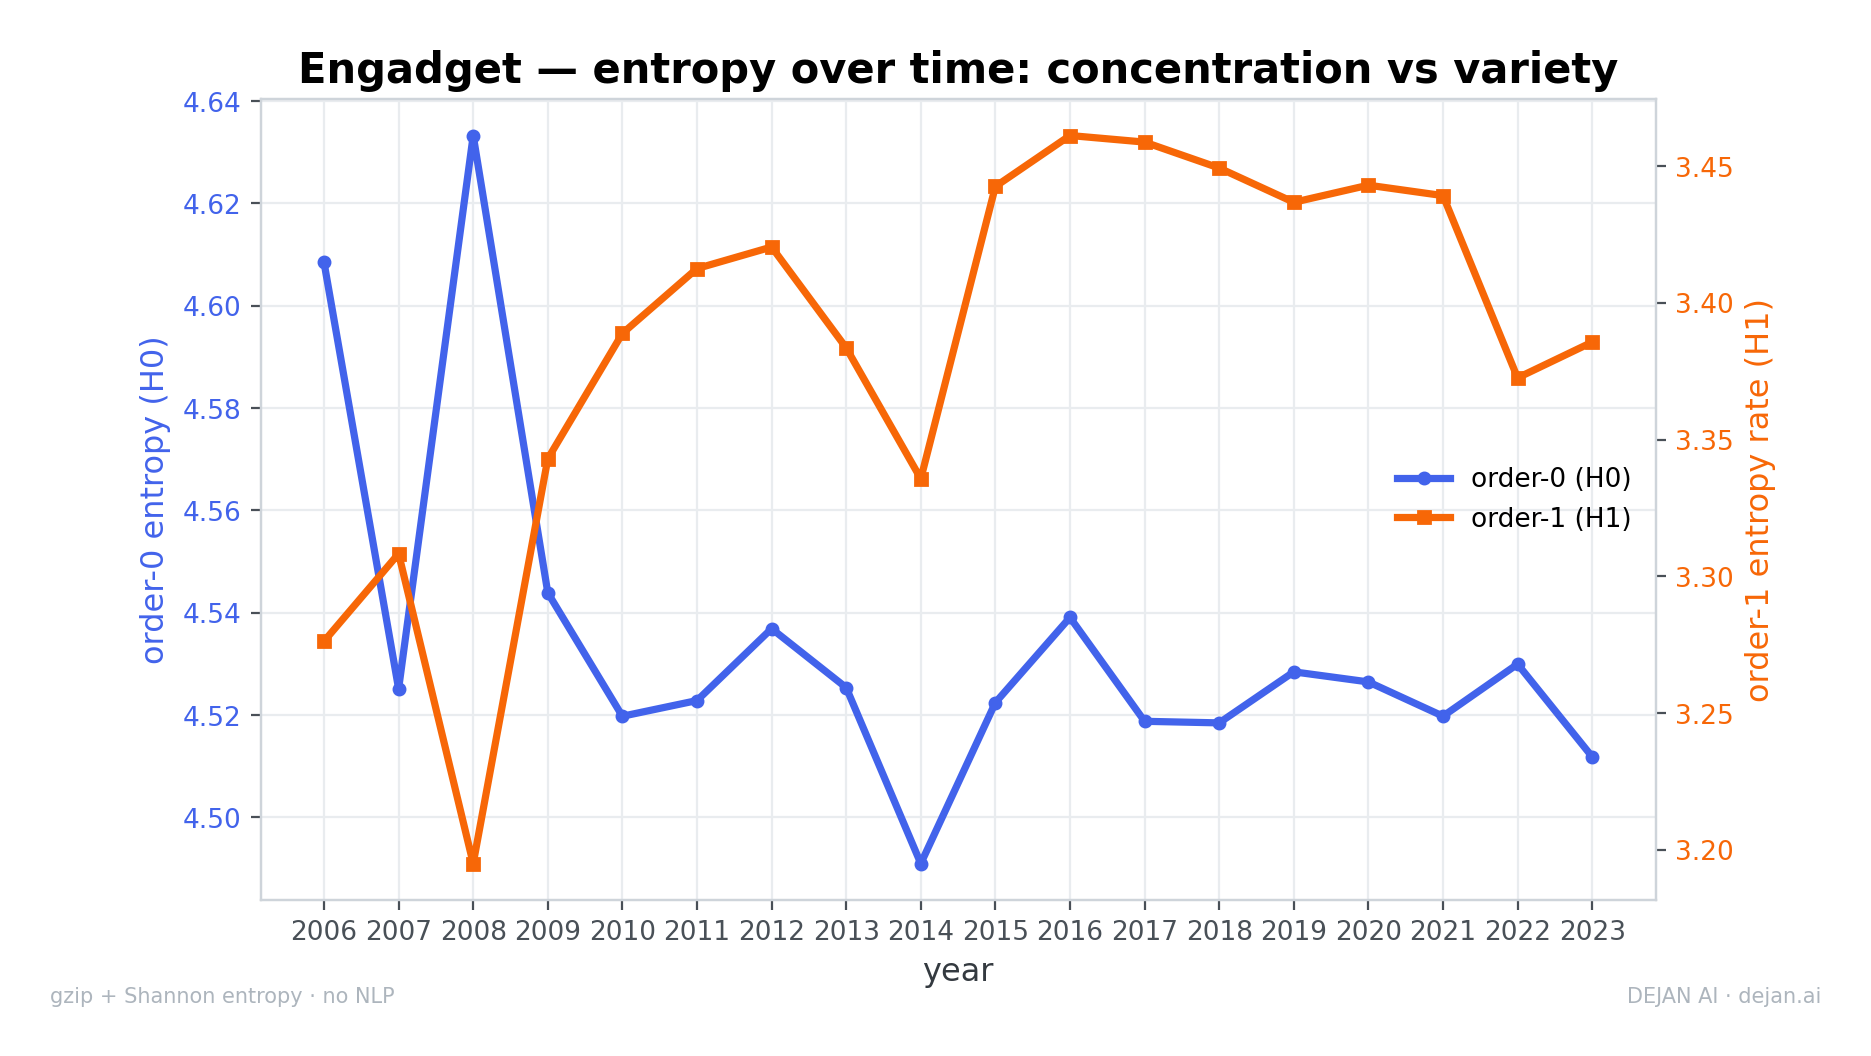
A dual-axis line chart plotting Engadget article entropy from 2006 to 2023 reveals generally opposing chronological trends.
Order-0 entropy is broadly stable — a shallow decline from 4.608 to 4.512 (−2.1%) across eighteen years. Order-1 entropy rises, 3.276 to 3.386 (+3.4%), reaching a plateau near 3.46 in the mid-2010s before easing at the end. As at other publishers, the character distribution holds roughly steady while adjacent-symbol variety edges up.
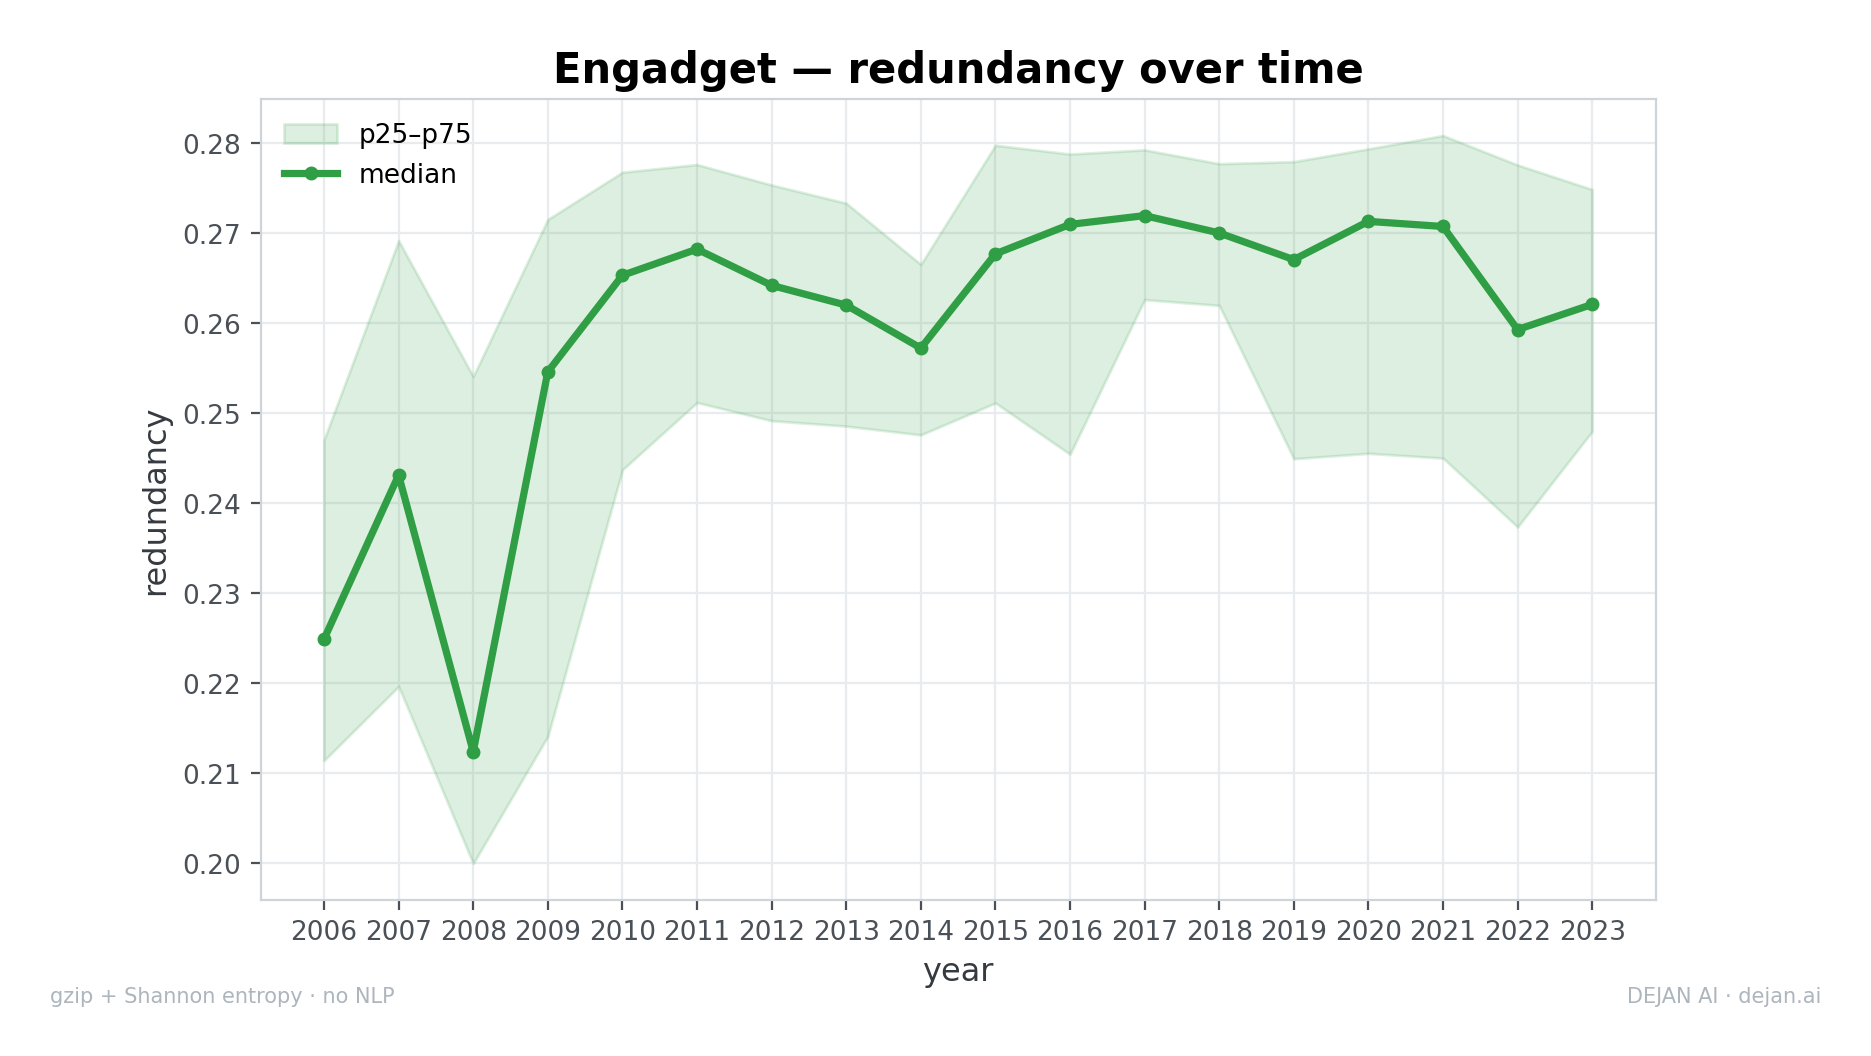
Median redundancy of Engadget articles rises from 2006, peaks in the mid-2010s, and slightly declines by 2023.
Redundancy climbs from 0.225 to 0.262 (+16.5%), most of the rise complete by the early 2010s, then a plateau near 0.27.
Several of the largest year-to-year moves land in 2006–2009, when the archive is thin and articles are short: order-0 entropy, the entropy rate, redundancy, and raw bits/byte all swing hard across 2007–2009 (the 2008-to-2009 redundancy jump of +20% is the single sharpest move in the corpus). These are the statistics of a young site finding its format, and they settle markedly once article volume grows after 2010.
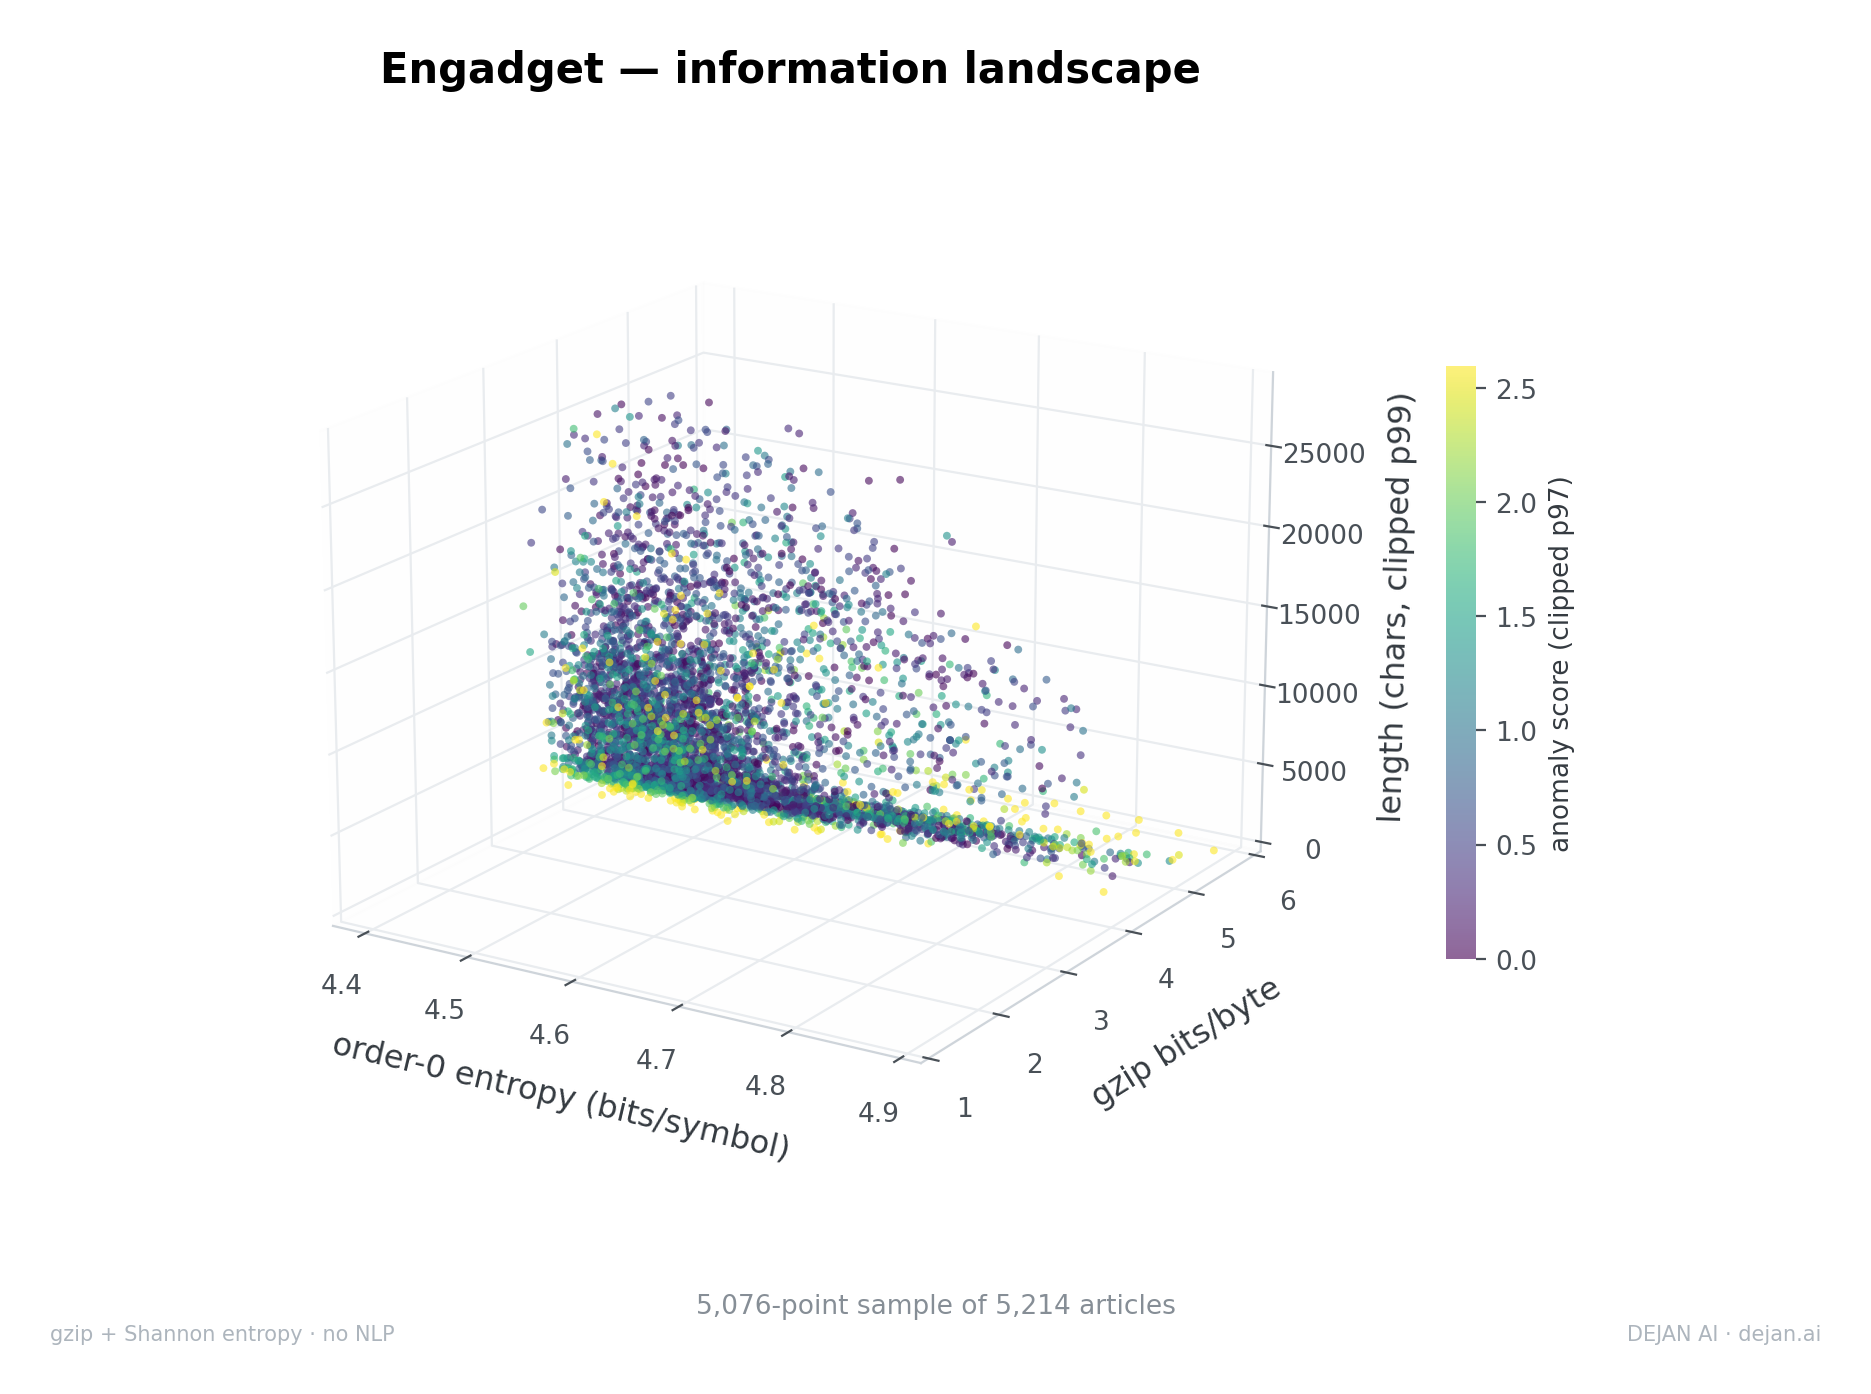
Three-dimensional scatter plot mapping article length against gzip bits per byte and entropy, showing shorter articles are less compressible.
Placed by entropy, compression and length, the cleaned articles form one continuous manifold rather than the split blob of the raw scrape. Length-normalized anomaly scoring — flagging articles that compress very differently from what their length predicts — now flags only 1.9%:
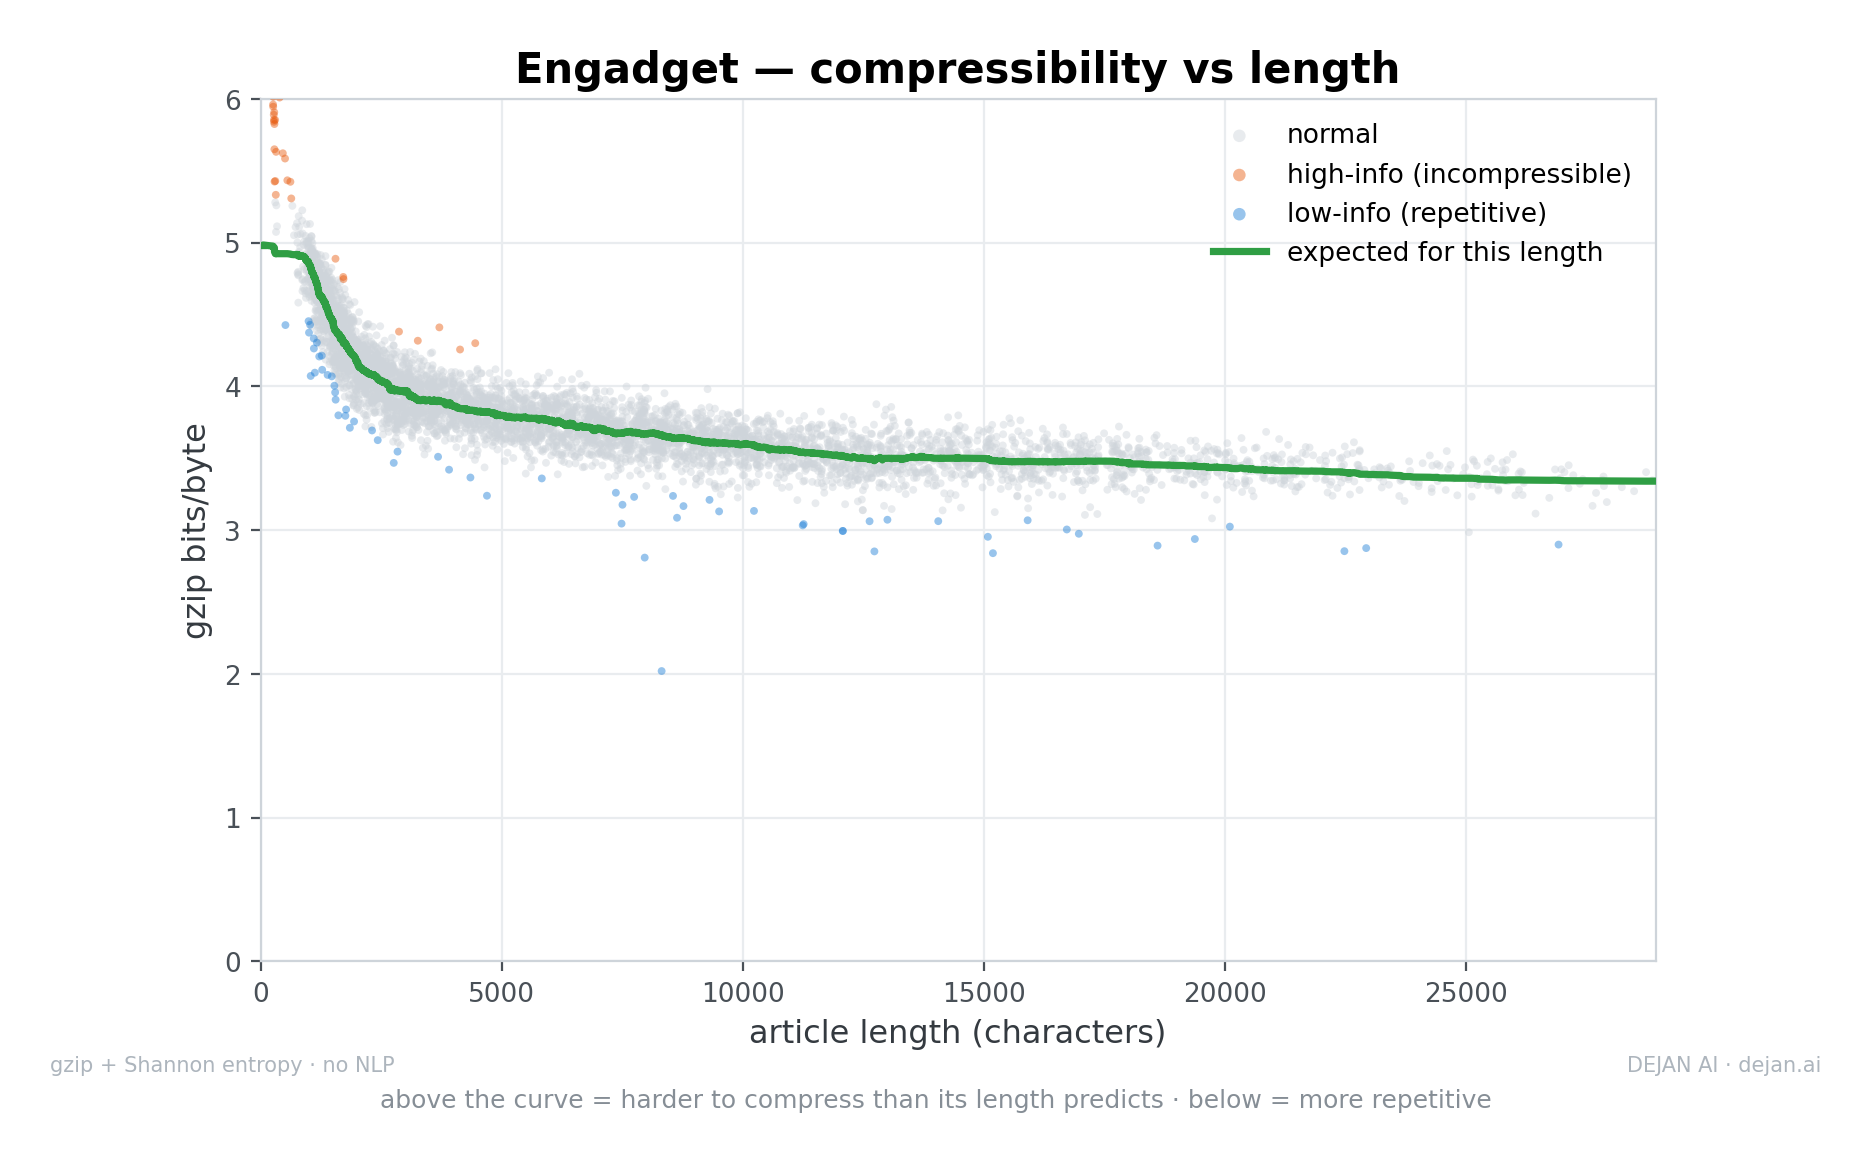
Scatter plot of article compressibility versus length showing that longer articles are more compressible along a downward curve.
Against length, the green curve is the expected bits/byte for each size; articles above it resist compression more than their length predicts, those below are more repetitive. The steep left edge — short articles compressing poorly — is exactly the confound Section 4.2 divides out.
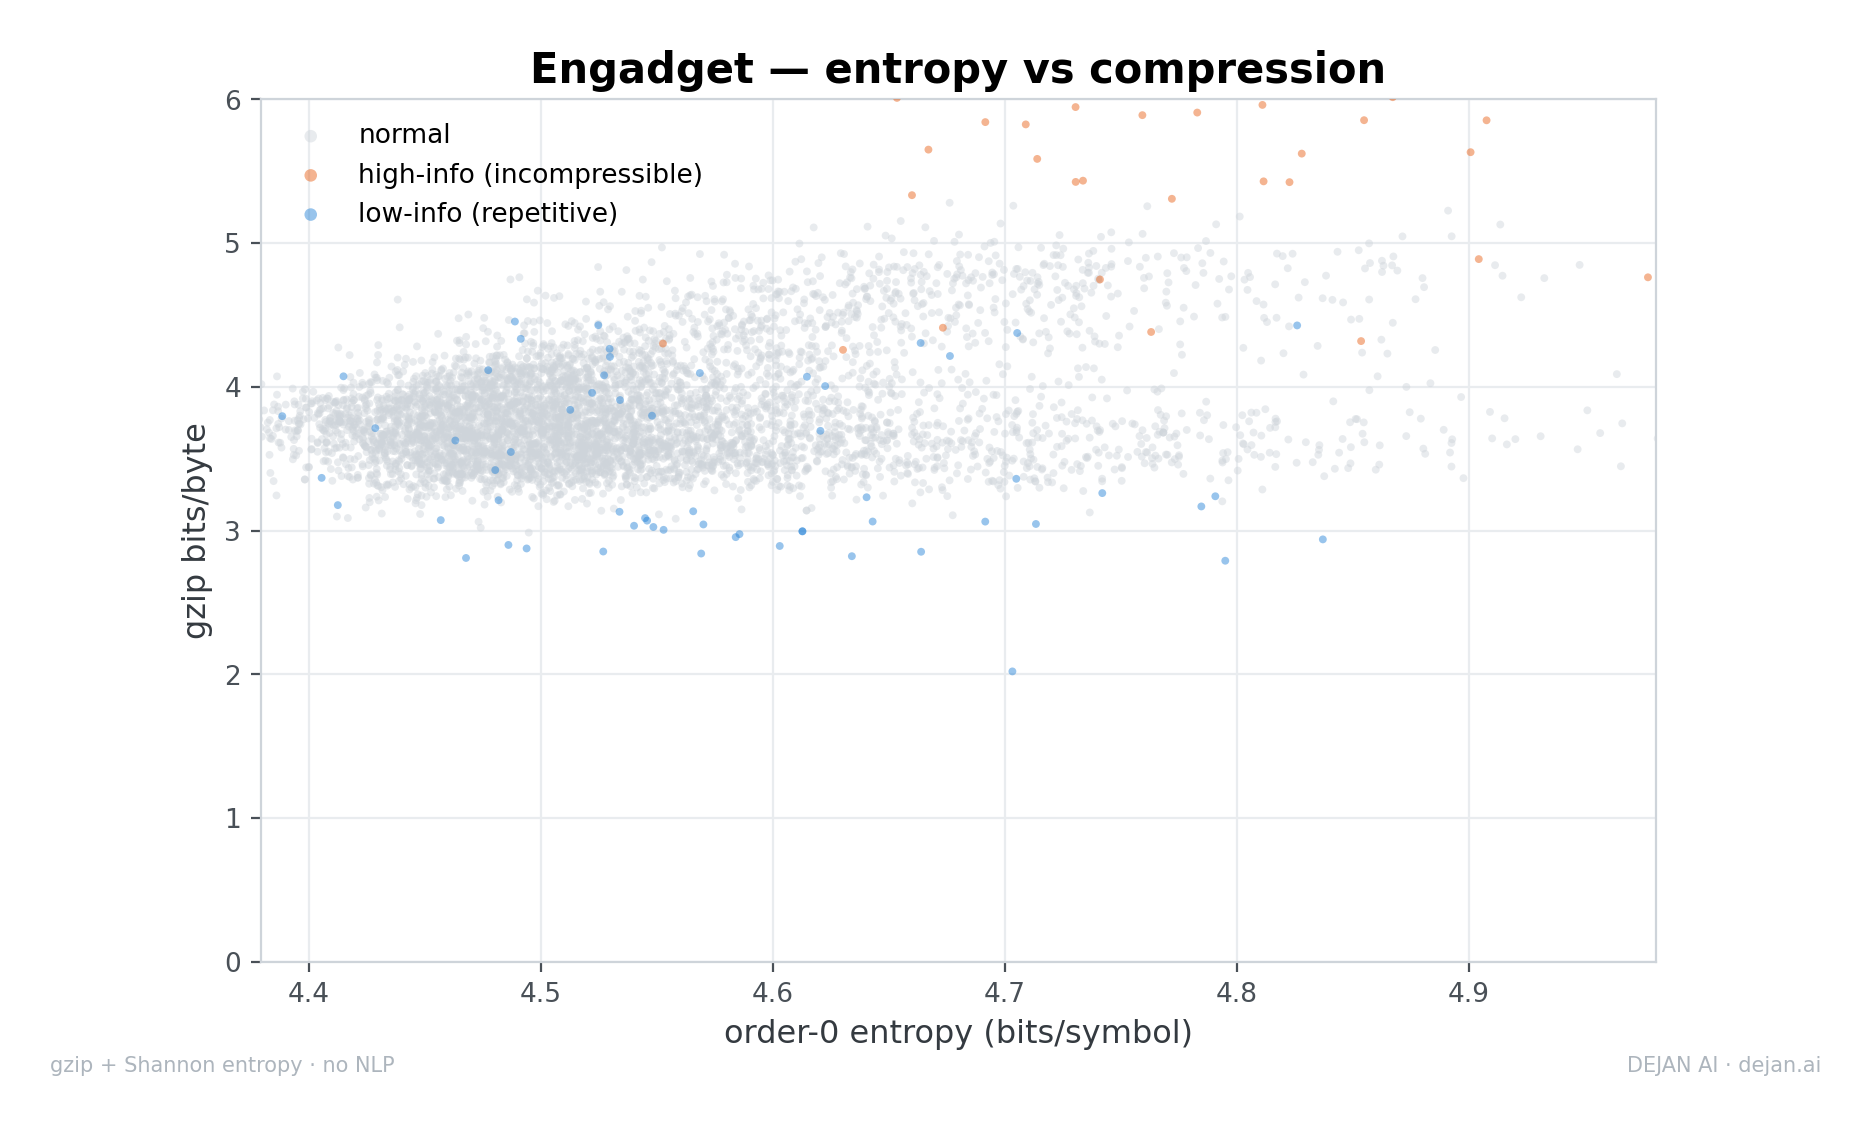
Scatter plot comparing order-0 entropy and gzip bits per byte for Engadget articles, showing a positive correlation.
Applying a robust z-score to the change in each yearly median (flagging \(\lvert z \rvert \ge 2\)) locates where the corpus turned:
| Metric | Transition | Move | z |
|---|---|---|---|
| Redundancy | 2008 → 2009 | 0.212 → 0.255 | +7.1 |
| \(H_1\) | 2008 → 2009 | 3.195 → 3.343 | +5.1 |
| Bits/byte (raw) | 2008 → 2009 | 4.648 → 3.958 | −5.9 |
| Redundancy | 2007 → 2008 | 0.243 → 0.212 | −5.4 |
| \(H_0\) | 2007 → 2008 | 4.525 → 4.633 | +4.6 |
| \(\text{bpb}_{\text{adj}}\) | 2022 → 2023 | −0.040 → −0.177 | −4.2 |
| Bits/byte (raw) | 2007 → 2008 | 4.211 → 4.648 | +4.0 |
| Length | 2014 → 2015 | 3,396 → 10,040 | +3.4 |
| Length | 2021 → 2022 | 8,654 → 4,166 | −2.5 |
Two things stand out. The turbulence is front-loaded in the formative years (2006–2009). And the clearest late events are structural rather than about symbols: the 2014→2015 tripling of length (the entry into the long-form era) and the 2022→2023 drop in length-adjusted compressibility.
On the cleaned corpus, the measurements establish that between 2006 and 2023 Engadget's articles:
What the numbers do not do is name a cause. A corpus that lengthens, peaks, and retreats — with a small residual drift in compressibility — is equally consistent with shifting formats (long features versus short news), template and redesign changes altering the site furniture the scrape captures, changes in staffing or house style, or a drift in topic mix. This method cannot separate those, because it never reads a word; it can only say, precisely, what moved and when. And, as Section 2 showed, it can say with confidence which pages were never articles at all.
Measured as symbols and bytes, Engadget's story has two layers. The first is a data-quality finding the method surfaces on its own: most of the scraped corpus was template boilerplate, cleanly separable from articles by compression alone. The second, on the genuine 5,214 articles, is an editorial arc distinct from the steady lengthening seen elsewhere — a rise into a mid-2010s long-form peak followed by a retreat, a compression signal that largely tracks that length while keeping a faint drift of its own, and a symbol distribution that barely moves across eighteen years.
Method: Shannon order-0 and order-1 entropy over Unicode code points, plus gzip compression over UTF-8 bytes, computed per article across the full recovered corpus. /products/ hub pages excluded by URL as non-article boilerplate (13,147 scraped → 5,214 articles; 5,207 dated). No natural-language processing is used at any stage. Length adjustment follows the corpus's own rolling-median length-to-compressibility curve. Dates recovered from URL and byline tokens by pattern match only. Absolute bits/byte reflect retained site furniture and are not comparable across publishers.
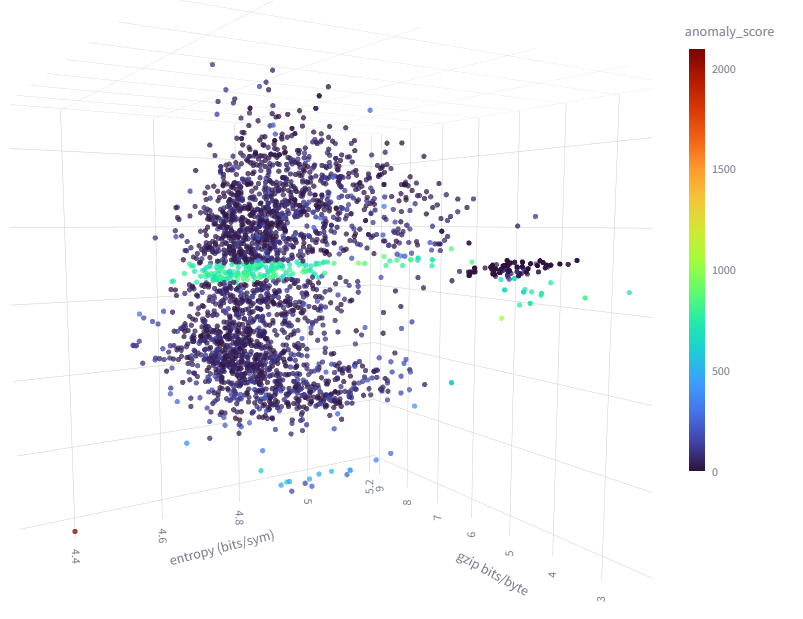
Information landscape (3D)
Three-dimensional scatter plot maps article entropy and compression rates, showing a dense central cluster alongside highly anomalous outliers. Each point is an article. x = order-0 entropy, y = gzip bits/byte, z = length. Color = anomaly score. · scatter shows a 6,000-point sample. 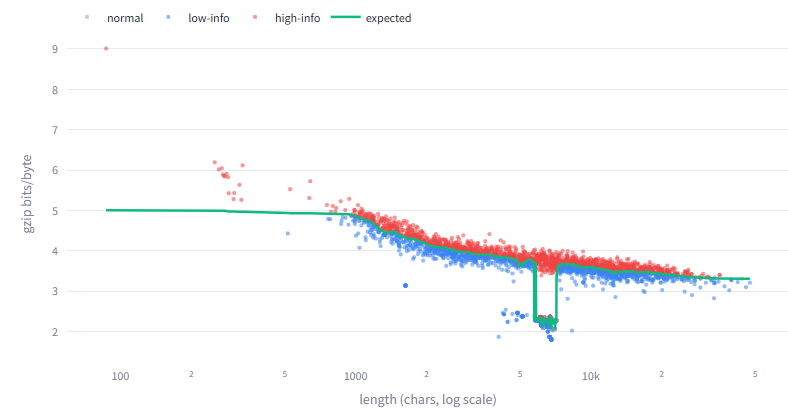
Compressibility vs length
The green curve is the expected bits/byte for each length. Points above it are more incompressible than their length predicts (fragmentary); points below are more repetitive. This is the baseline the length-normalized score measures against.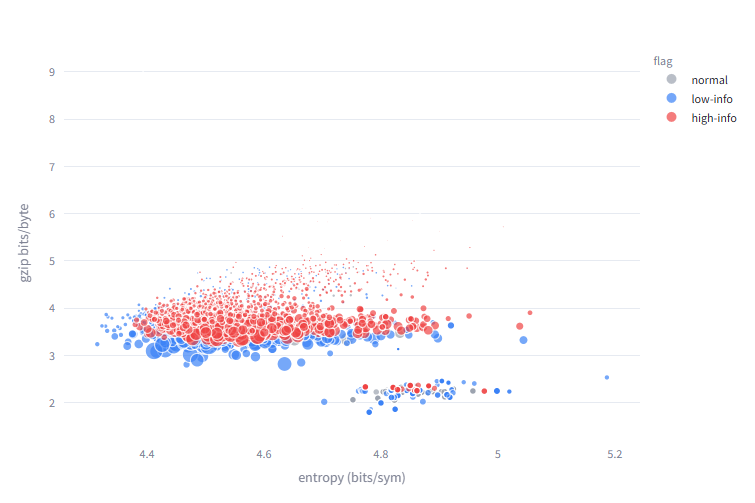
Entropy vs compression
Scatter plot mapping gzip bits per byte against entropy, showing article data clustered by information level flags.
Order-0 entropy
Histogram displays the bimodal distribution of order-zero entropy values across the analyzed text corpus.