 Dan Petrovic ·
19 July 2026
Dan Petrovic ·
19 July 2026
This paper profiles the recovered corpus of The Verge from 2011 to 2023 using Shannon entropy and data compression to analyze changes in article structure.
This paper profiles the complete recovered corpus of The Verge — 152,192 dated articles published between 2011 and 2023 — using nothing but Shannon entropy and data compression. No language model, no parser, no notion of words or topics is involved: each article is treated as a stream of symbols and a stream of bytes, and every figure below is either an entropy measurement over symbol frequencies or a compression measurement over bytes. Across twelve years the corpus records a small number of large, coordinated movements — article length more than doubled, raw compressibility fell in lockstep, vocabulary concentration rose while local sequential variety rose with it, and by 2019 every metric had settled into a narrow, stable band. The purpose of this paper is to lay the measurements out plainly and in aggregate, and to be explicit about what the signal can and cannot attribute. The causes are left to the reader.
Six quantities are extracted per article. Five are stored directly; the sixth is derived across the corpus.
The engine has no linguistic knowledge whatsoever. Where the text below says "vocabulary" or "phrasing," it is a shorthand for the symbol-level statistics defined above, not a claim about words or grammar.
Every article in the store carries a recovered publish date, so this is a census, not a sample: 152,192 of 152,649 stored articles (99.7%) are dated, spanning 2011 through 2023. The two endpoint years are partial — 2011 is the site's first months (5,013 articles) and 2023 is the scrape's cutoff (5,286 articles) — while 2012 is the fullest year at 18,547.
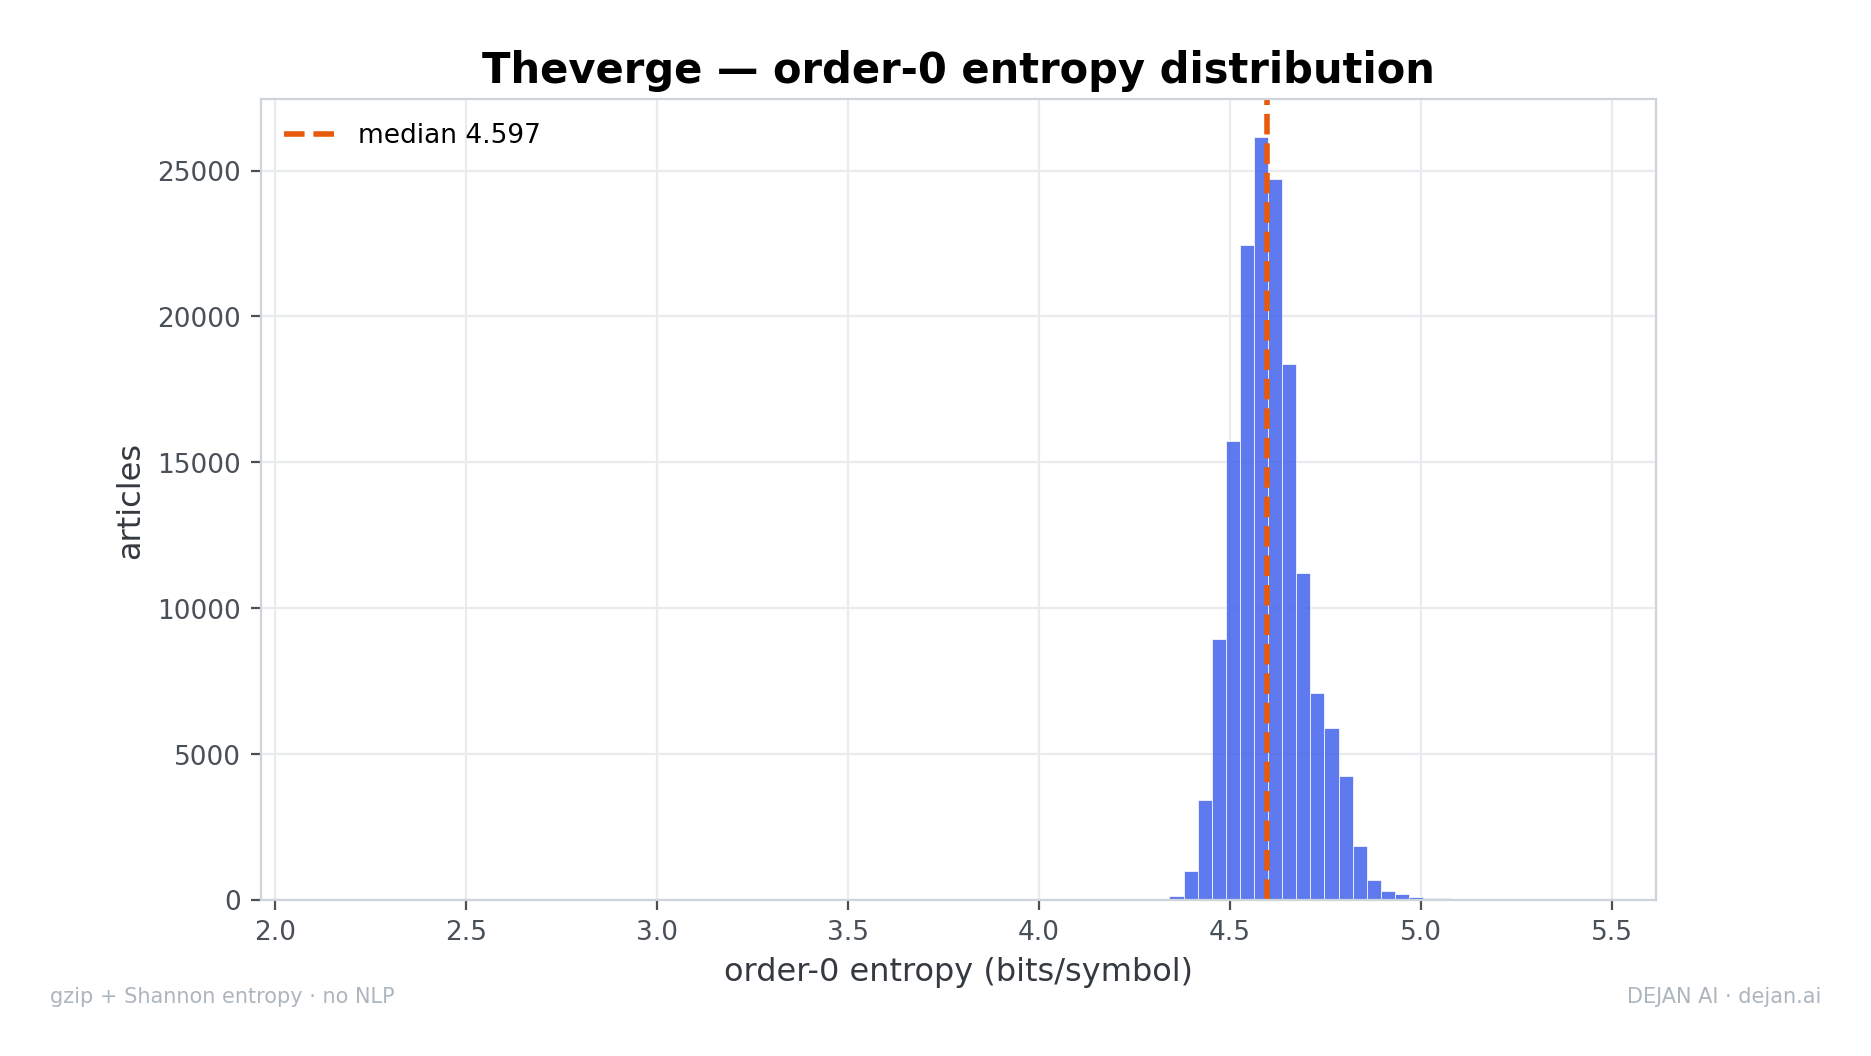
Taken as a single undated pile, the corpus is remarkably tight around its centre:
| Metric | Median | p25 | p75 |
|---|---|---|---|
| Order-0 entropy \(H_0\) | 4.597 | 4.541 | 4.658 |
| Order-1 entropy \(H_1\) | 3.359 | 3.313 | 3.403 |
| Redundancy \(R\) | 0.251 | 0.239 | 0.264 |
| Bits/byte (raw) | 2.108 | 1.987 | 2.226 |
| Length (chars) | 5,723 | 4,333 | 8,533 |
The full per-year medians are the factual core of this paper:
| Year | n | \(H_0\) | \(H_1\) | \(R\) | bpb (raw) | \(\text{bpb}_{\text{adj}}\) | Length |
|---|---|---|---|---|---|---|---|
| 2011 | 5,013 | 4.671 | 3.307 | 0.234 | 2.236 | −0.005 | 3,961 |
| 2012 | 18,547 | 4.644 | 3.314 | 0.239 | 2.166 | −0.030 | 4,347 |
| 2013 | 15,844 | 4.622 | 3.346 | 0.244 | 2.196 | +0.013 | 4,713 |
| 2014 | 12,184 | 4.608 | 3.350 | 0.248 | 2.198 | +0.022 | 4,940 |
| 2015 | 13,764 | 4.601 | 3.358 | 0.249 | 2.184 | +0.026 | 5,235 |
| 2016 | 15,252 | 4.597 | 3.362 | 0.251 | 2.158 | +0.021 | 5,419 |
| 2017 | 12,737 | 4.577 | 3.367 | 0.257 | 2.089 | +0.006 | 6,129 |
| 2018 | 11,475 | 4.569 | 3.370 | 0.258 | 2.058 | −0.006 | 6,543 |
| 2019 | 10,678 | 4.565 | 3.376 | 0.260 | 2.022 | −0.011 | 7,253 |
| 2020 | 10,623 | 4.573 | 3.373 | 0.258 | 2.019 | −0.019 | 7,155 |
| 2021 | 10,595 | 4.582 | 3.375 | 0.256 | 2.022 | −0.019 | 7,075 |
| 2022 | 10,193 | 4.576 | 3.385 | 0.258 | 2.002 | −0.014 | 7,721 |
| 2023 | 5,286 | 4.579 | 3.395 | 0.259 | 1.984 | −0.012 | 8,376 |
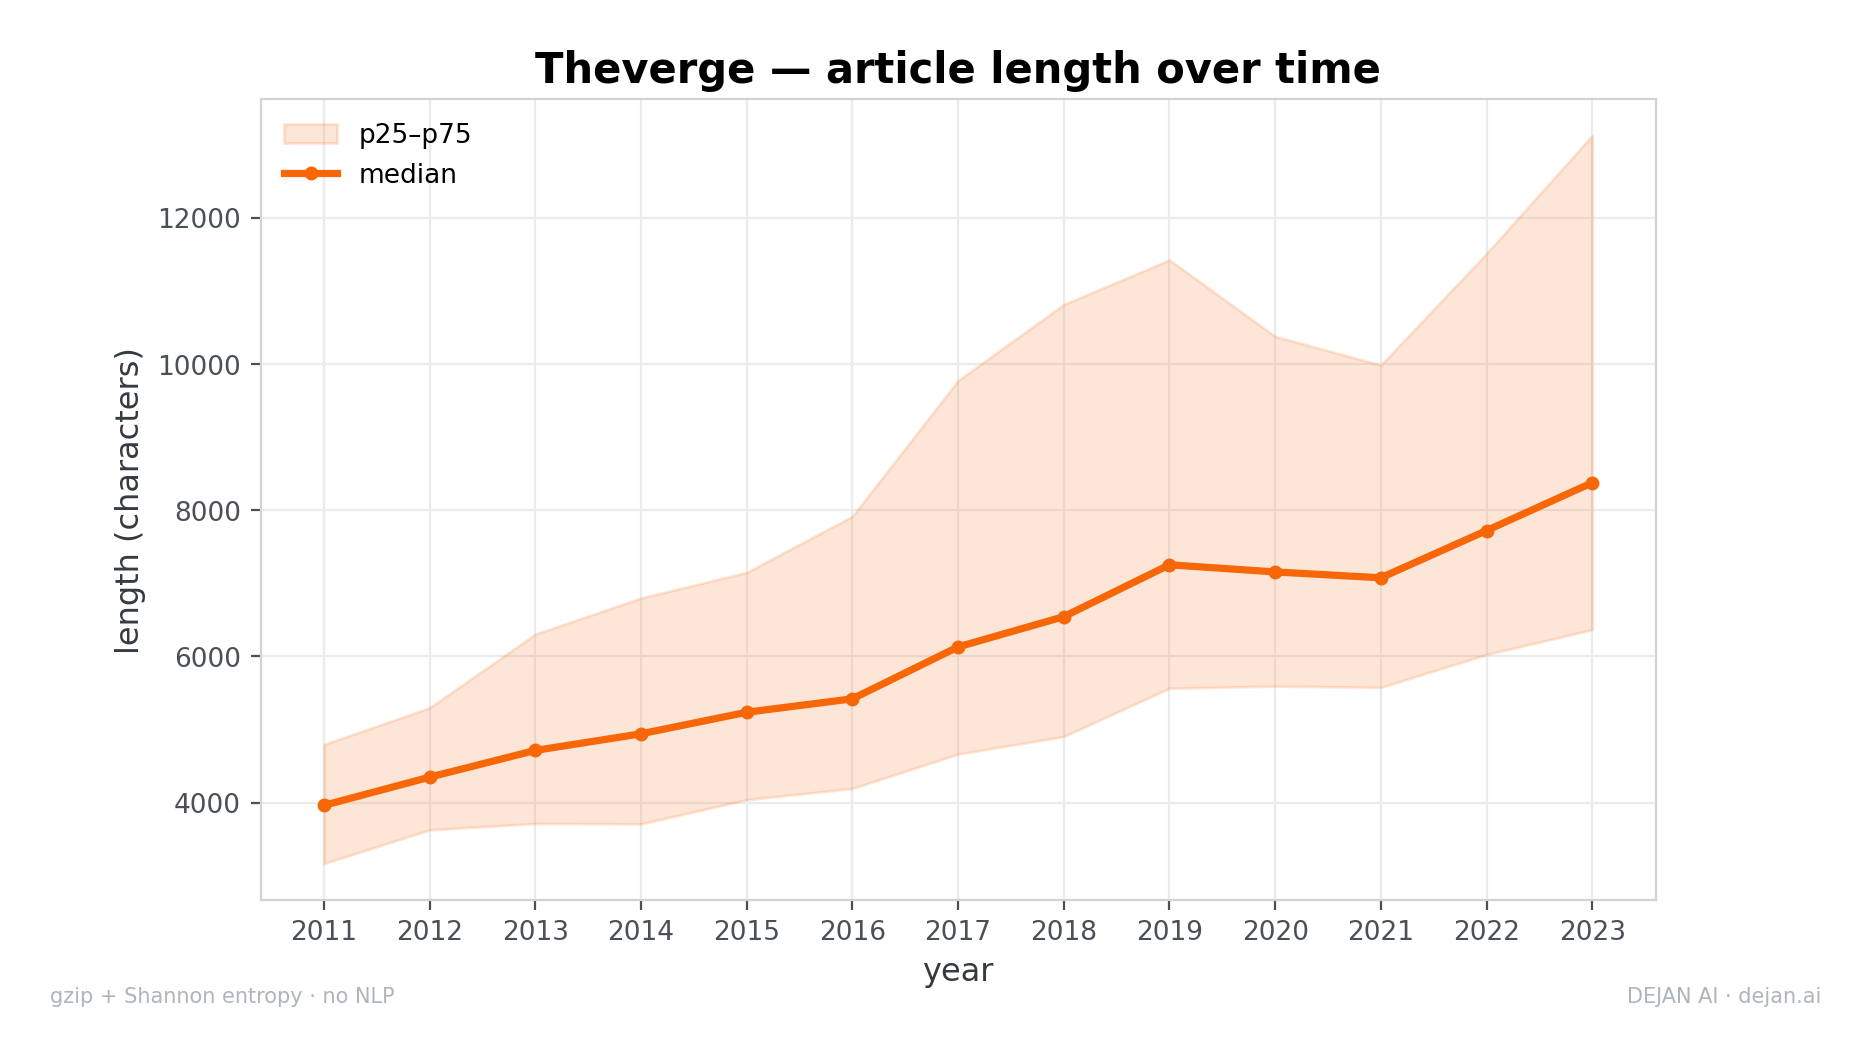
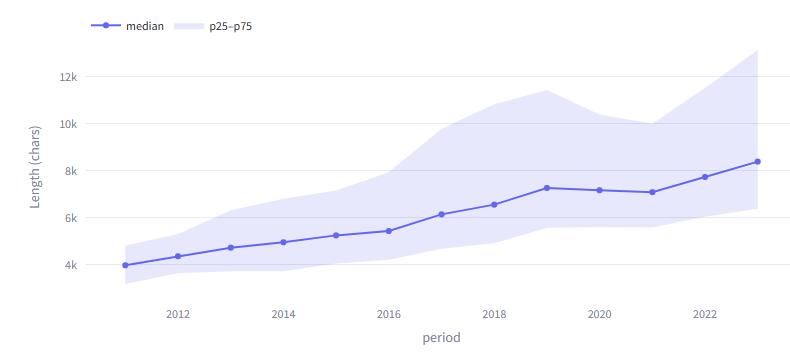
The largest change in the corpus, by far, is size. Median article length climbs from 3,961 characters in 2011 to 8,376 in 2023 — a 111% increase — and the growth does not plateau; it continues to the last full data. The upper tail stretches even further than the median: the 75th percentile runs from 4,795 characters in 2011 to 13,127 in 2023, so the corpus did not merely shift longer, it fanned open as long-form work entered a catalogue that began as short posts.
| Year | p25 | Median | p75 |
|---|---|---|---|
| 2011 | 3,165 | 3,961 | 4,795 |
| 2019 | 5,564 | 7,253 | 11,425 |
| 2023 | 6,365 | 8,376 | 13,127 |
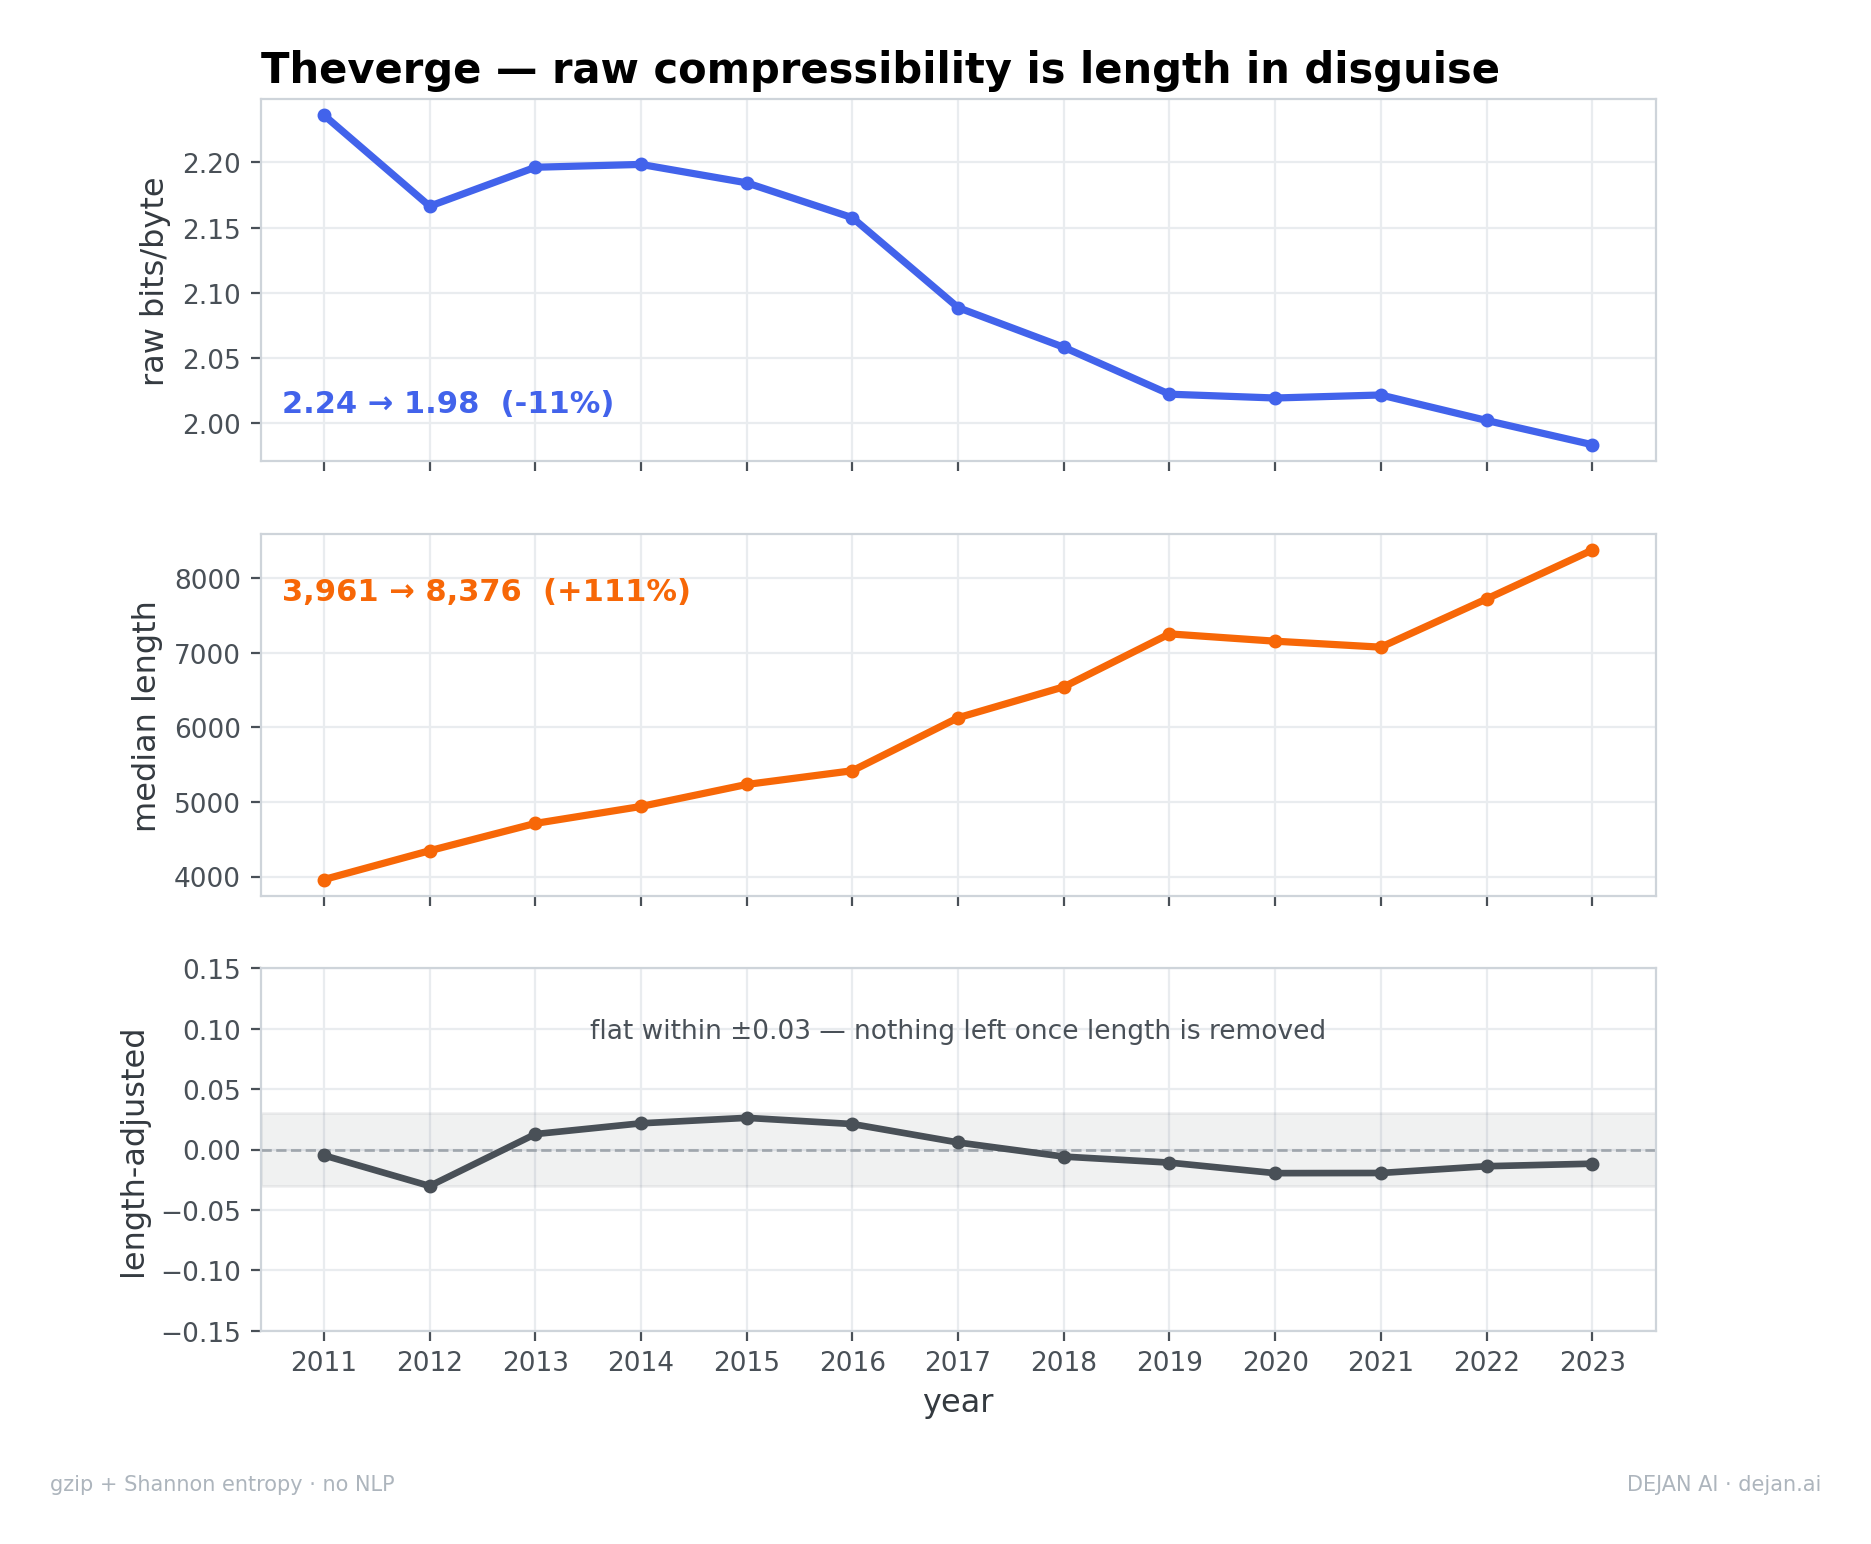
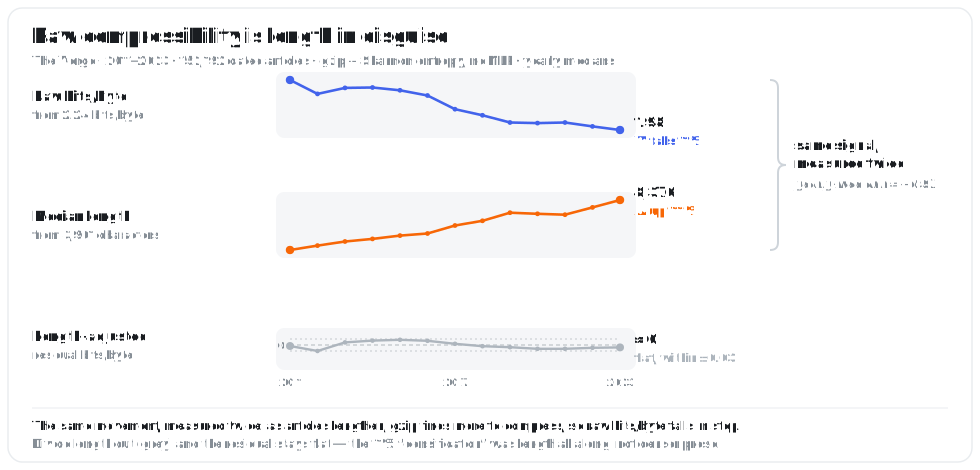
Raw bits/byte declines steadily, from a median of 2.236 in 2011 to 1.984 in 2023 (−11.3%), with two of the sharpest single steps at 2011→2012 and 2016→2017. Read alone, this looks like a decade-long rise in "information density."
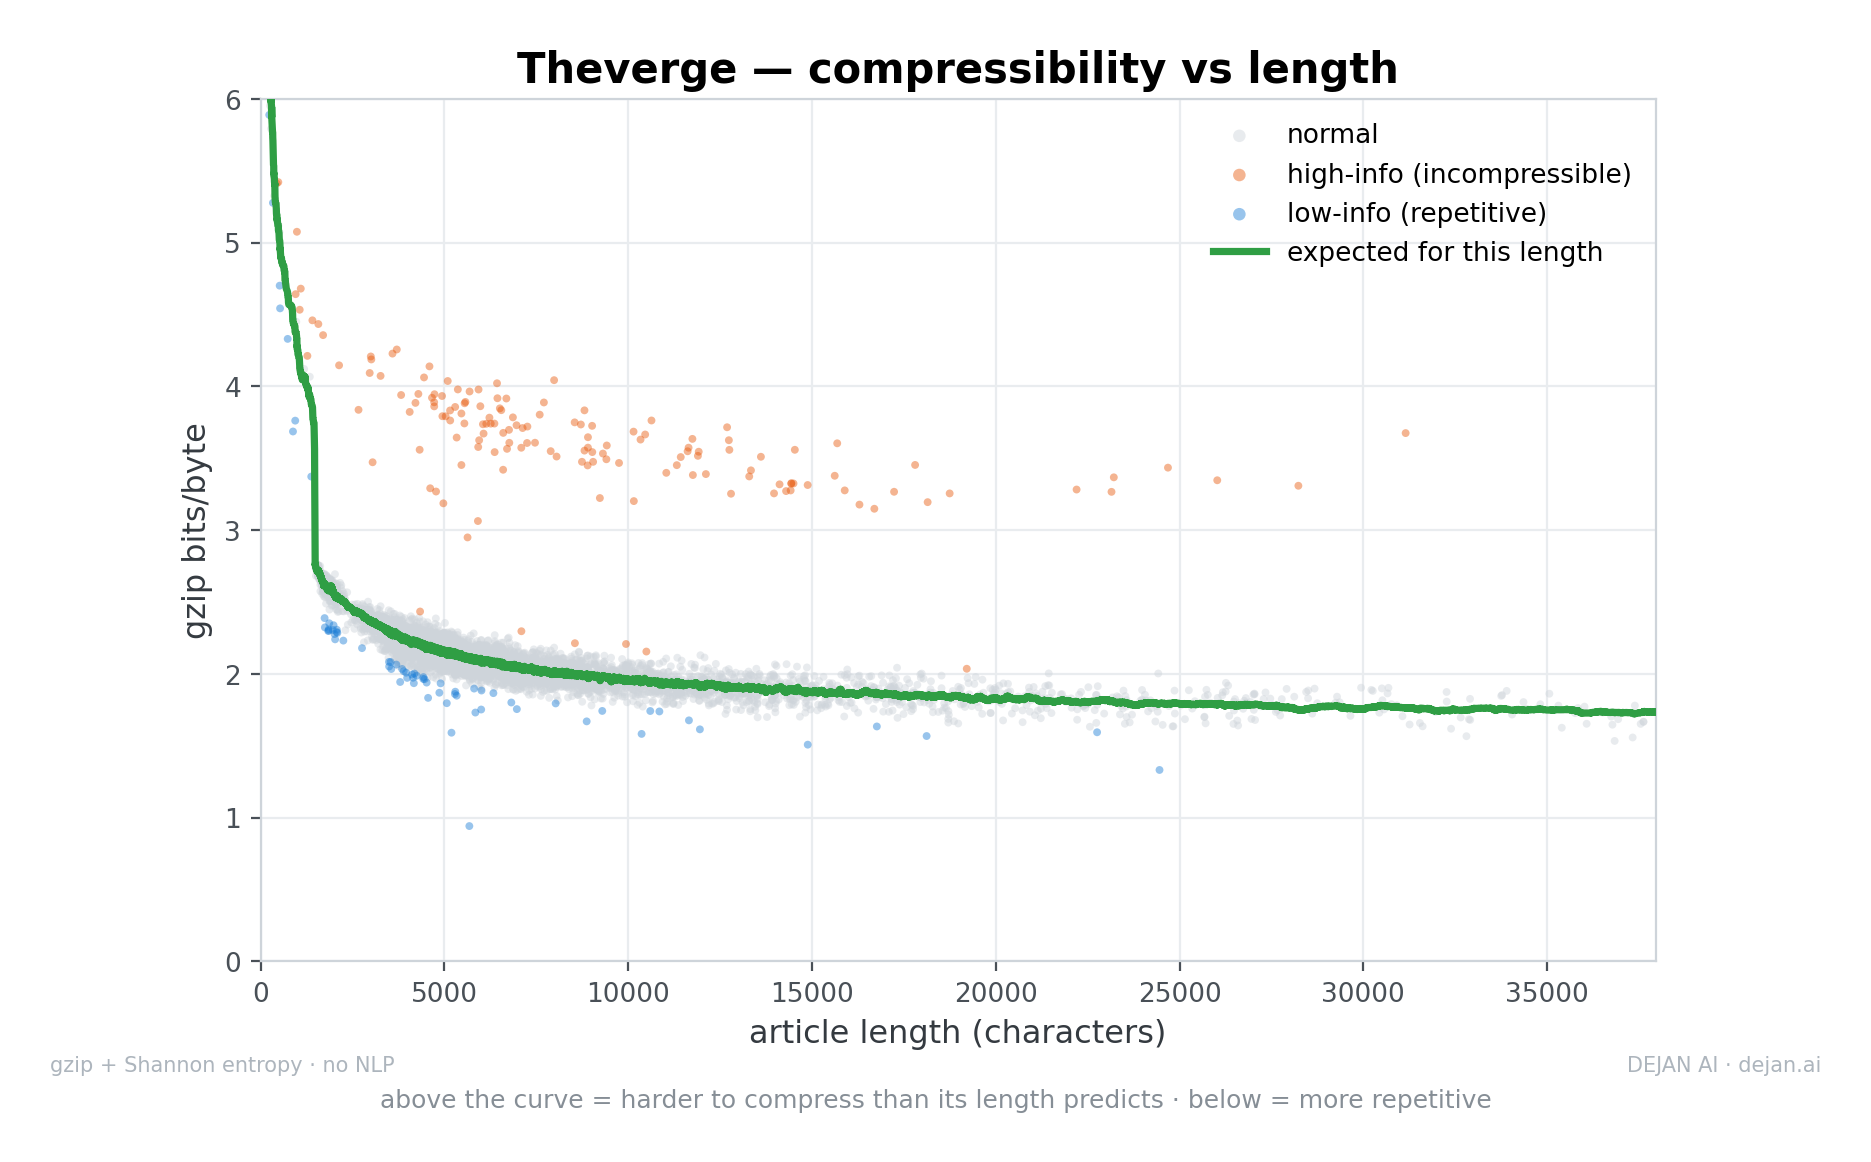
It is almost entirely an artefact of length. The relationship between size and raw compressibility is strongly monotonic — longer documents give gzip a warmer dictionary and compress better per byte — but it is nonlinear, which is why it looks weak article-by-article and overwhelming in aggregate:
At the level this paper reports — yearly medians — length accounts for 94.5% of the movement in raw compressibility. Once that is divided out, the length-adjusted figure \(\text{bpb}_{\text{adj}}\) stays within ±0.03 bits/byte of zero for all thirteen years — roughly ±1.4% of the 2.1 baseline. There is no meaningful structural compressibility trend independent of length. The eleven-percent "densification" is the shadow of longer articles, not a change in how compressible the prose itself is.
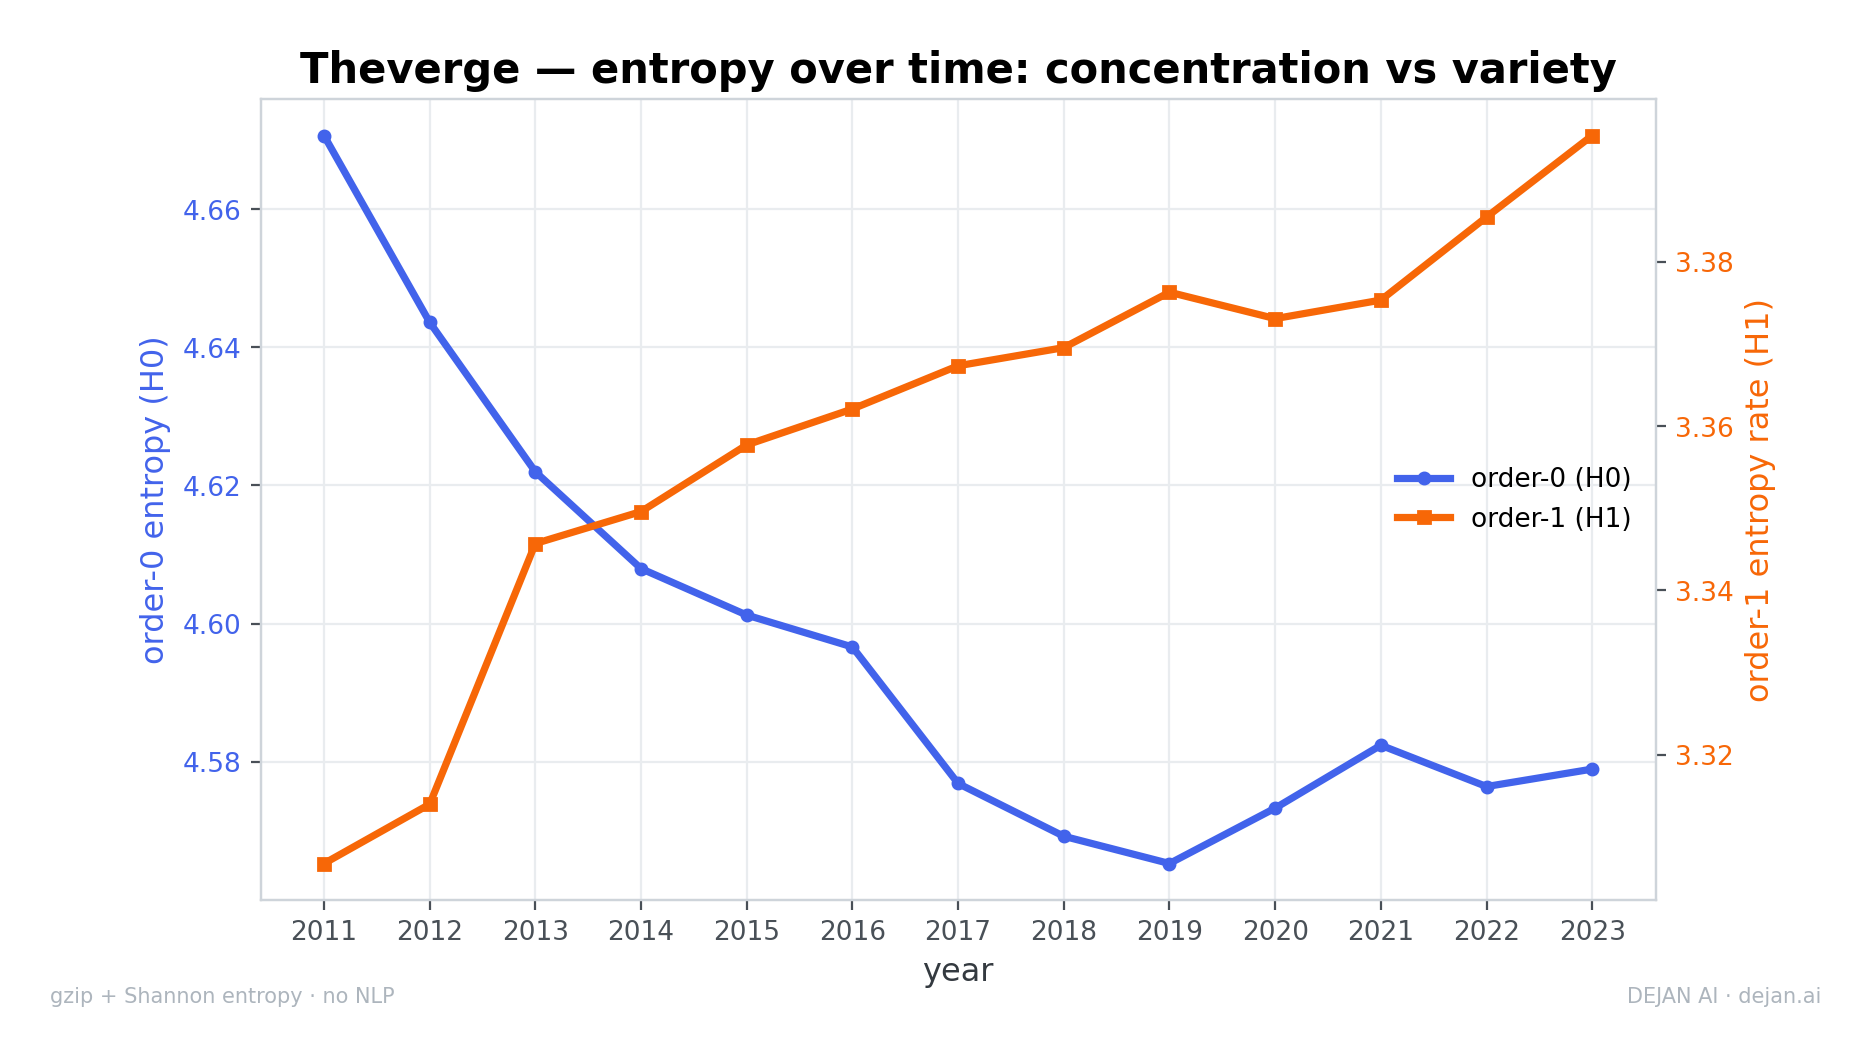
The two entropy measures diverge, and the split is consistent across the whole span:
So character usage became slightly more concentrated while the variety of adjacent-symbol combinations increased. These are not contradictory: a narrower set of characters can still be arranged in less predictable local sequences.
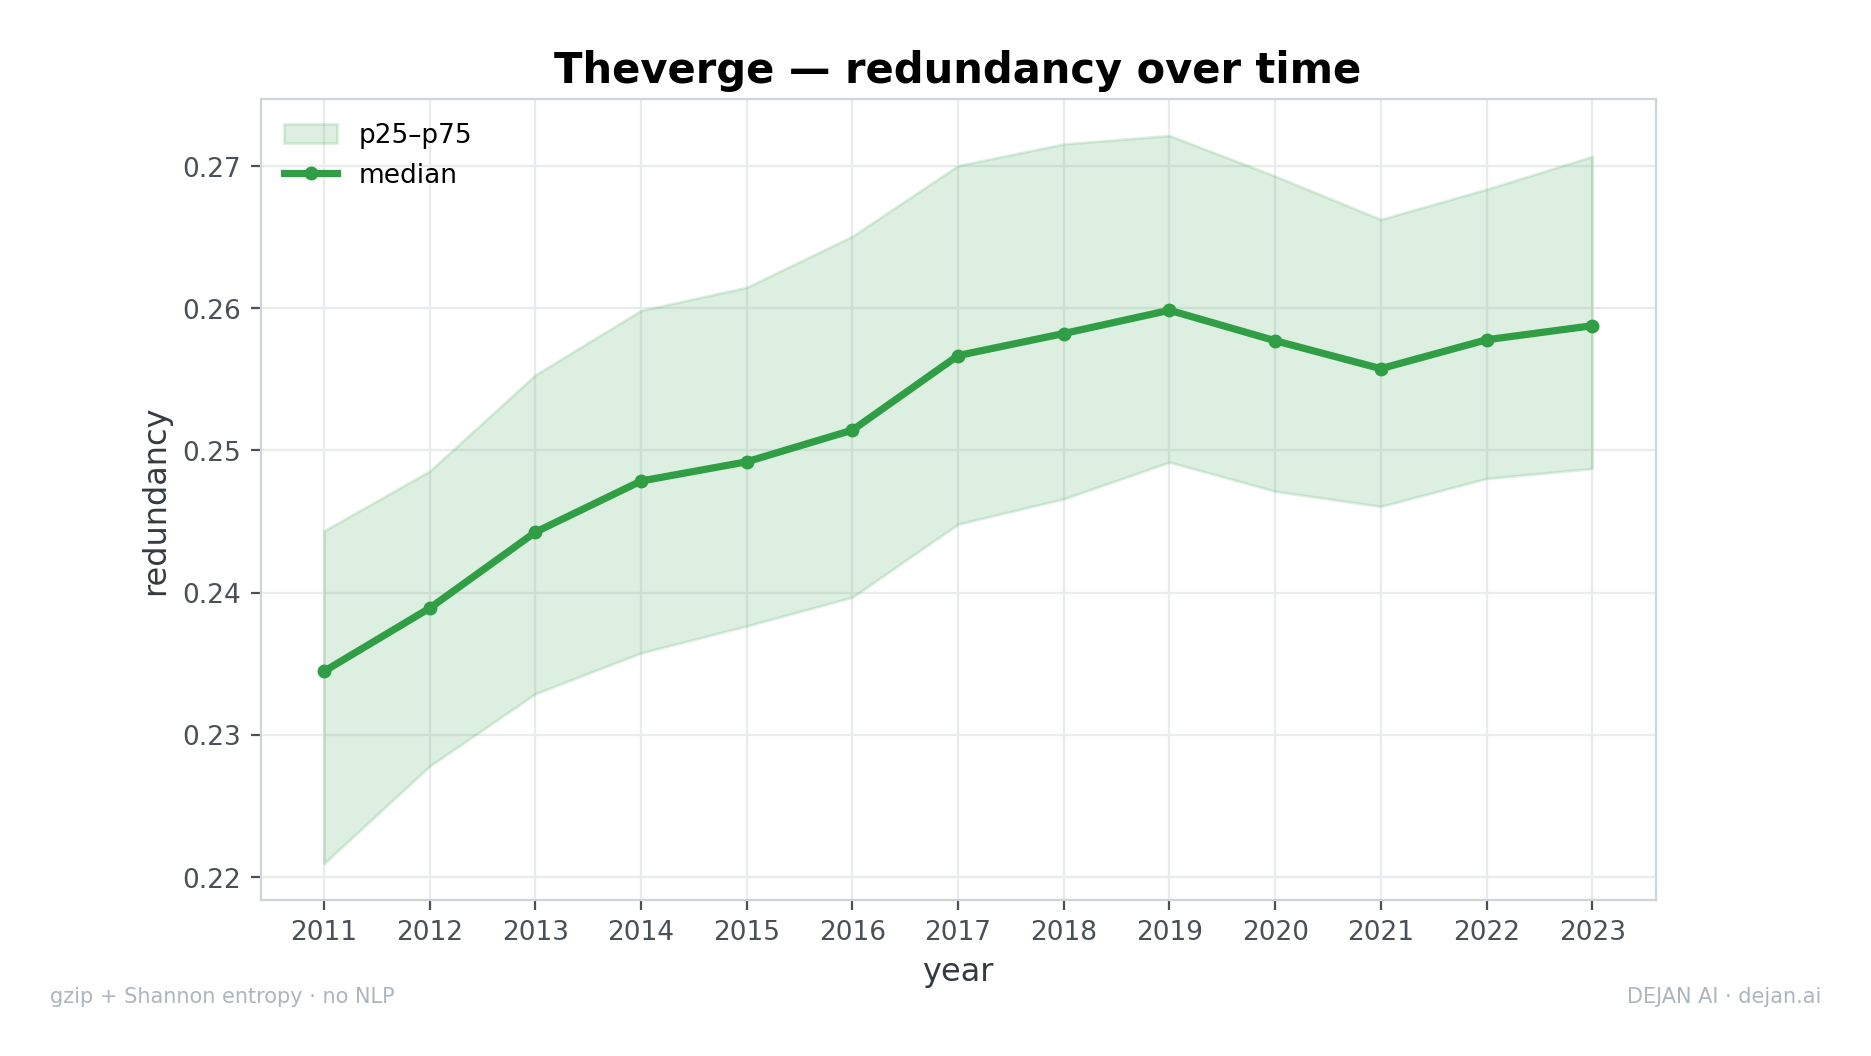
Redundancy rises from 0.234 to 0.259 (+10.4%), climbing to about 0.260 by 2019 and then holding flat. Because \(R\) is defined against \(H_0\), this is the same concentration seen in Section 3.3 viewed from the alphabet's side: a steadily larger share of each article's symbol capacity became predictable filler through the 2010s, then stopped moving.
The final gestalt of the timeline is convergence. Across \(H_0\), redundancy, and length-adjusted compressibility, the inter-quartile bands narrow through the decade and the medians flatten from roughly 2019 onward. The corpus travels from a wide, volatile early regime (2011–2013, the widest spreads and the two biggest entropy shifts) into a tight, stable late regime (2019–2023) where year-to-year movement in every metric except length has fallen to noise.
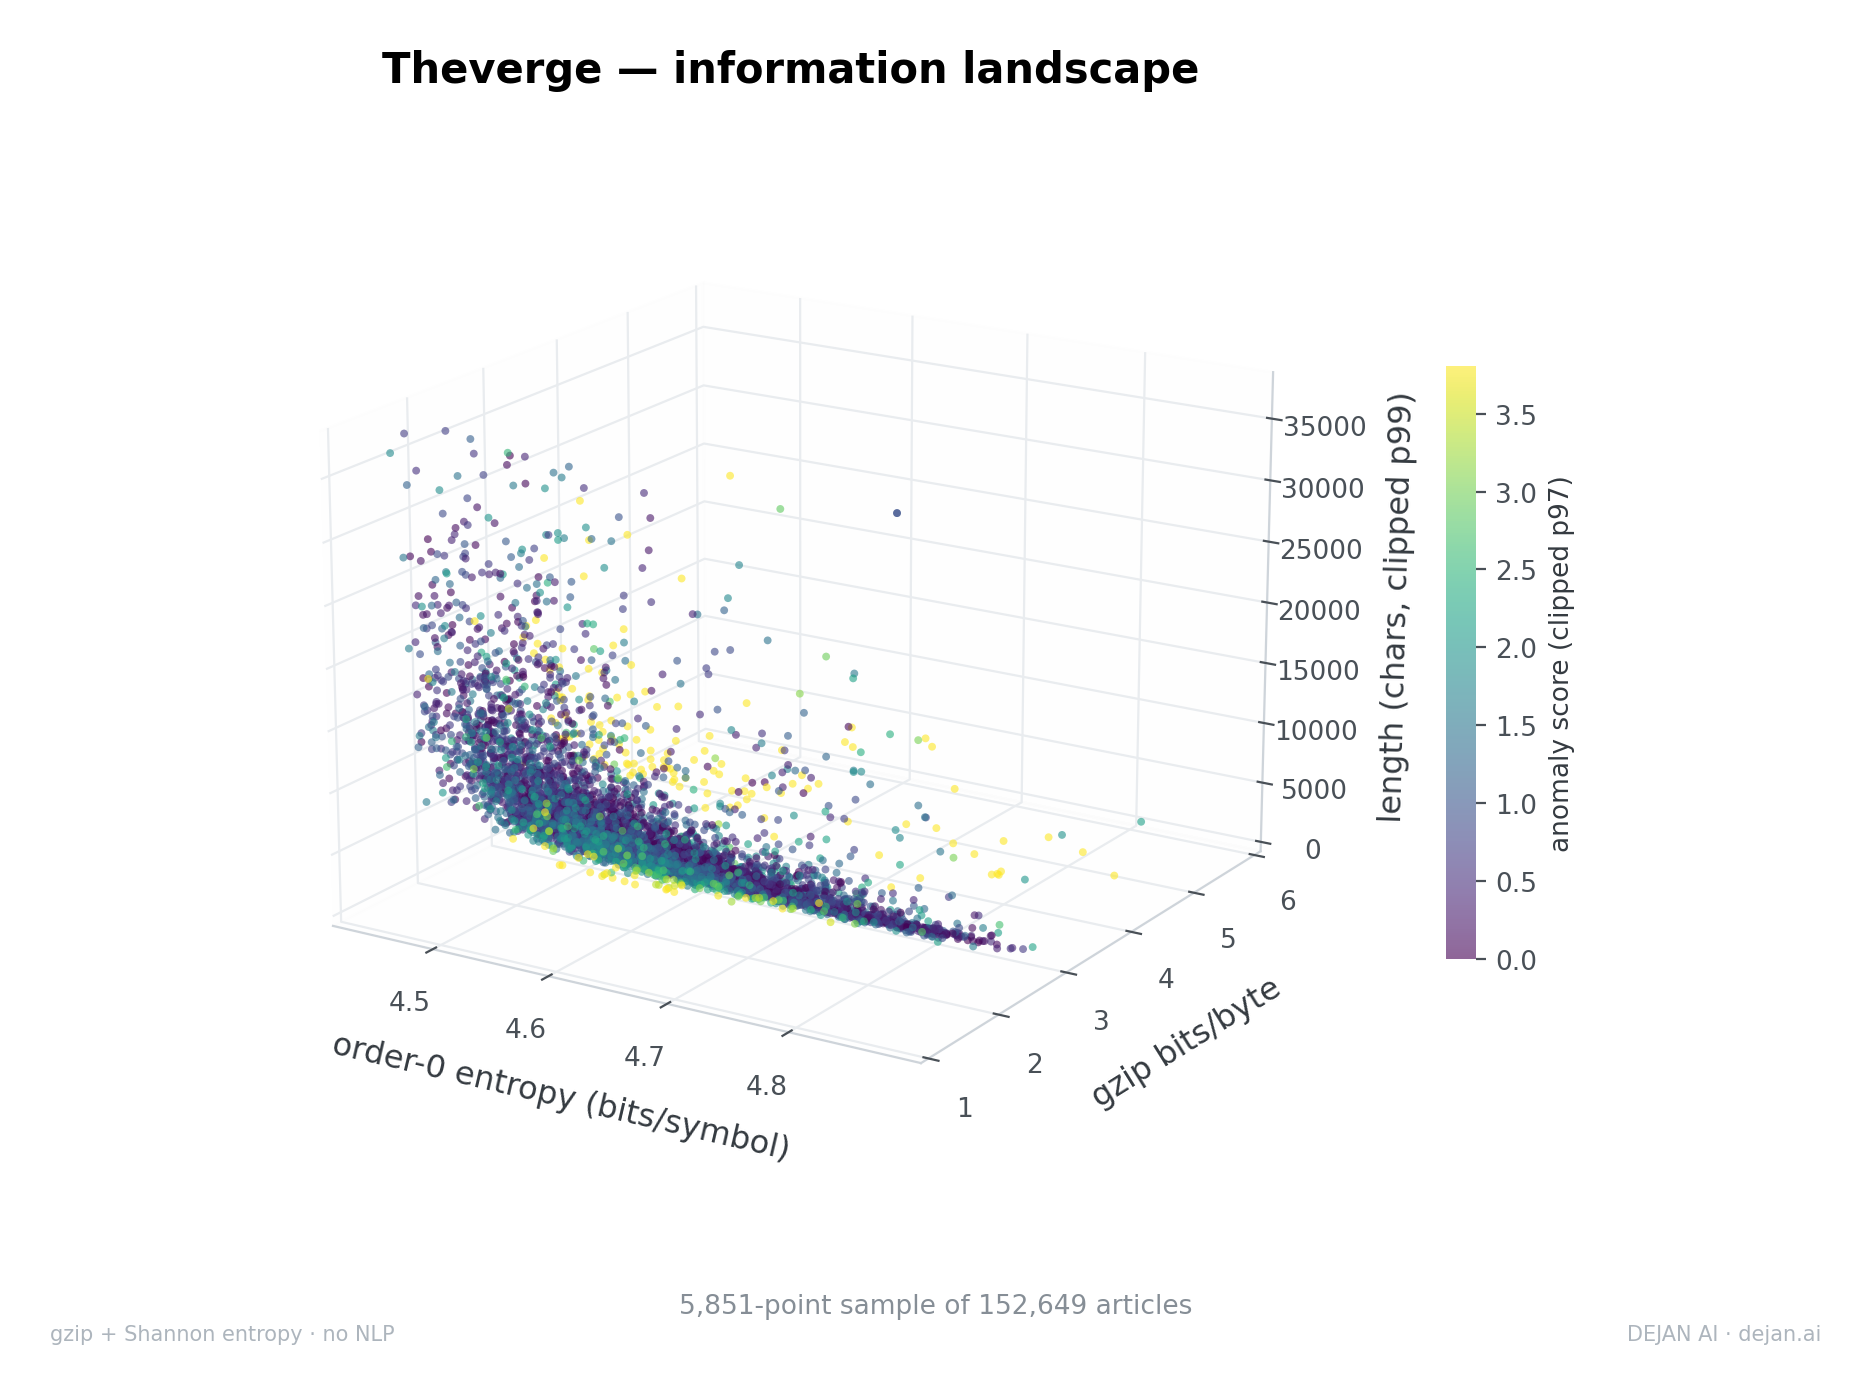
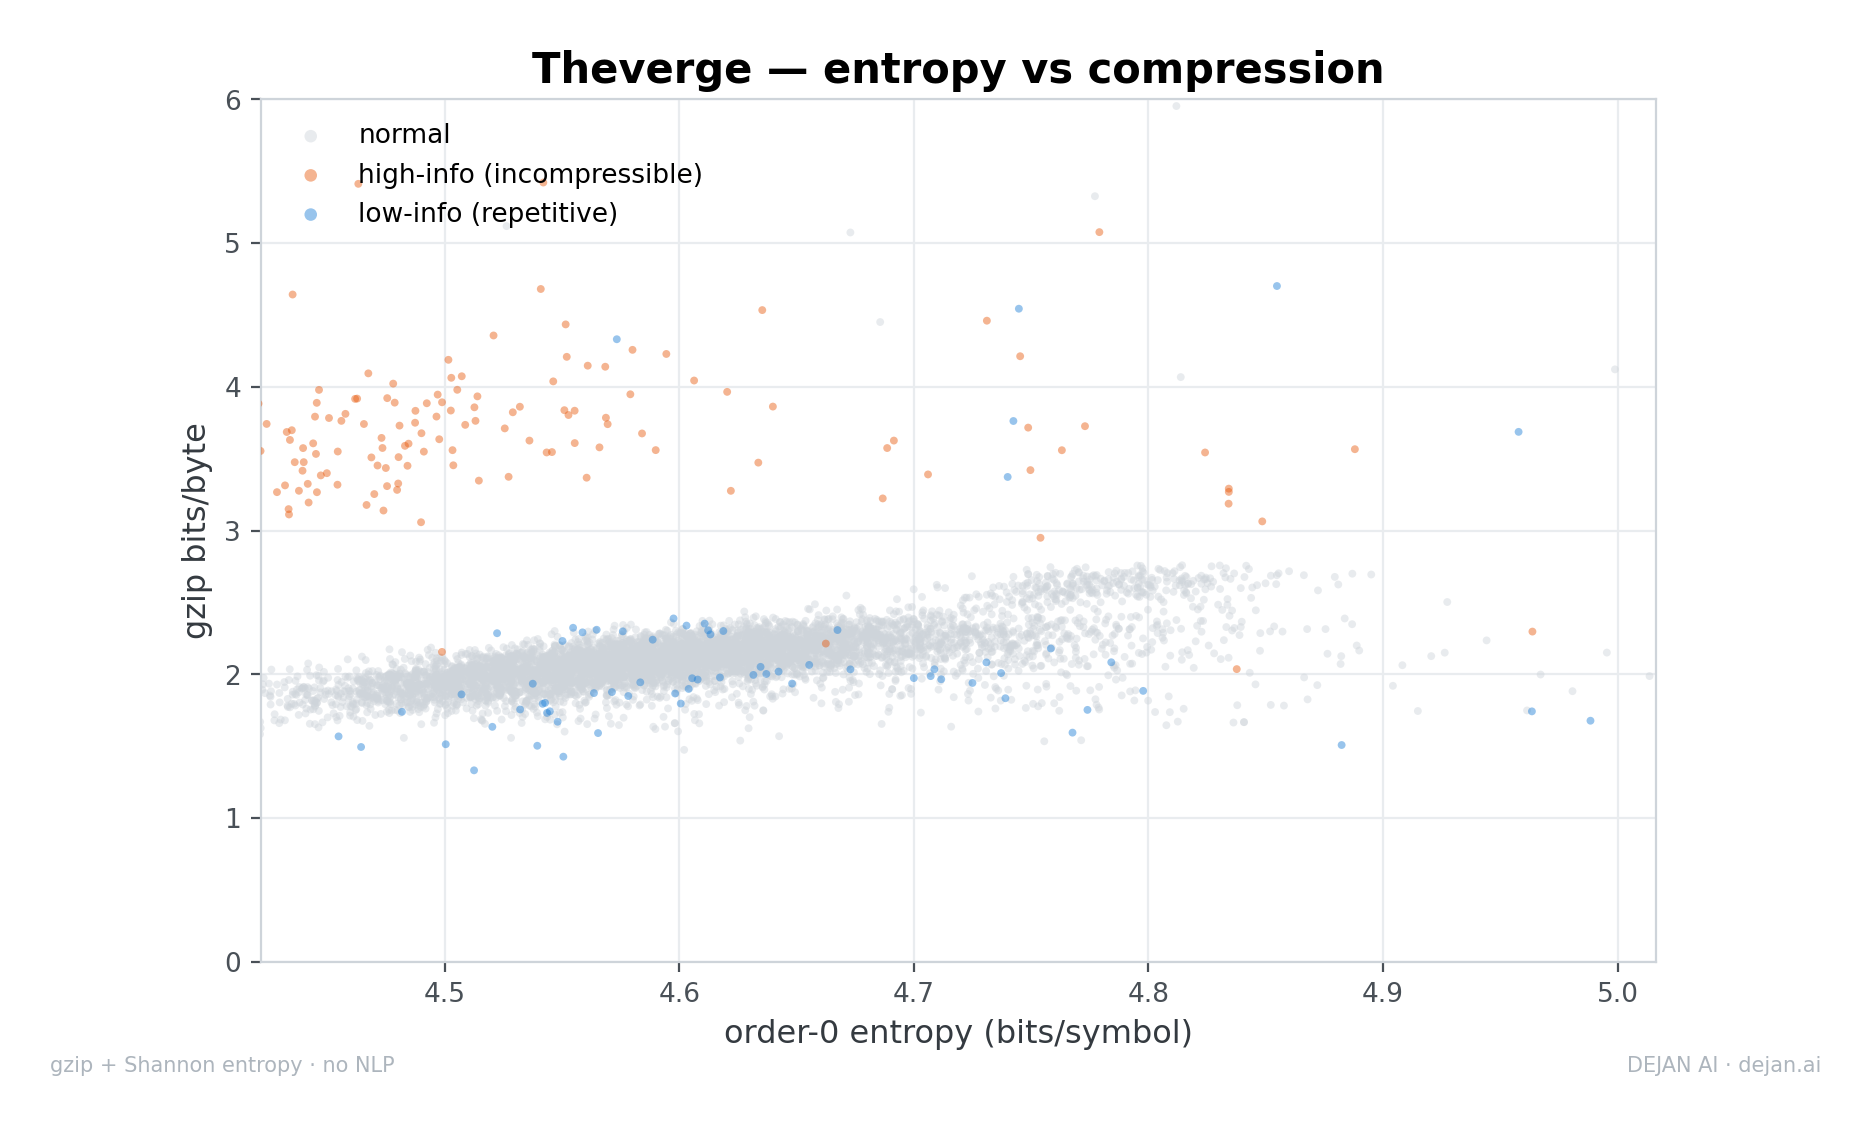
Viewed all at once rather than over time, the 152,649 stored articles form one dense cluster with two thin anomaly wings. Anomalies here are length-normalized: an article is flagged not for being short or long, but for compressing very differently from what its length predicts.
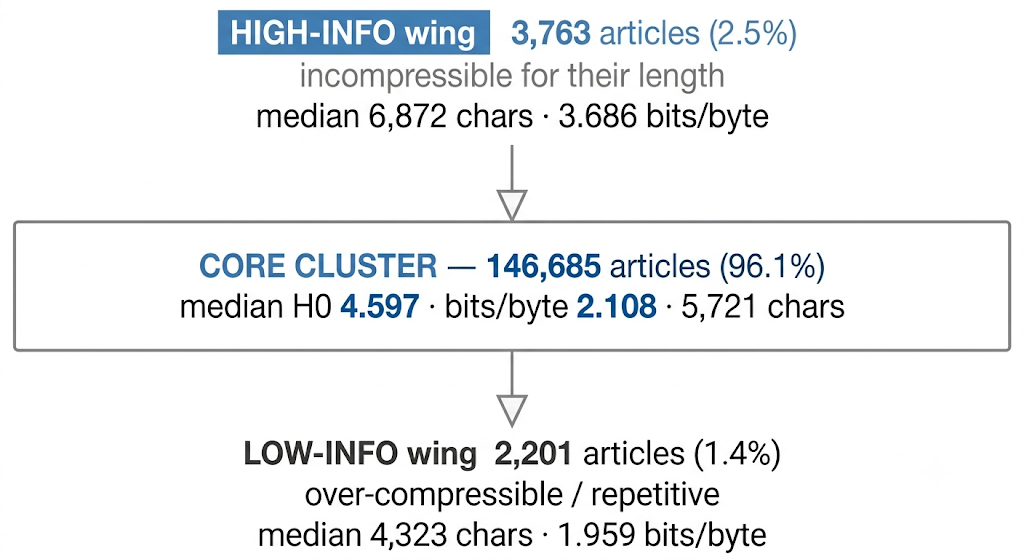
Two features are worth stating precisely. First, the flagged fraction is small — 3.9% of the corpus, with 96.1% sitting in the core. Second, the high-information wing is not made of short stubs: its median length is 6,872 characters, above the corpus median. These are normal-to-long articles that resist compression more than their size warrants (fragmentary structure, tables, code, transcripts, dense non-prose). The low-information wing is the mirror image — articles that compress away far more easily than their length implies, i.e. highly repetitive or templated pages.
Applying a robust z-score to the year-to-year change in each yearly median (flagging \(\lvert z \rvert \ge 2\)) surfaces exactly where the corpus turned:
| Metric | Transition | Move | z |
|---|---|---|---|
| \(H_1\) | 2012 → 2013 | 3.314 → 3.346 | +5.9 |
| \(H_1\) | 2019 → 2020 | 3.376 → 3.373 | −2.1 |
| Redundancy | 2019 → 2020 | 0.260 → 0.258 | −2.1 |
| Bits/byte (raw) | 2011 → 2012 | 2.236 → 2.166 | −2.1 |
| Bits/byte (raw) | 2016 → 2017 | 2.158 → 2.089 | −2.0 |
| \(\text{bpb}_{\text{adj}}\) | 2011 → 2012 | −0.005 → −0.030 | −2.1 |
| \(\text{bpb}_{\text{adj}}\) | 2012 → 2013 | −0.030 → +0.013 | +4.1 |
Two cautions on reading this table. The single strongest event in the entire corpus is the 2012→2013 jump in order-1 entropy — a genuine, sharp change in local sequential structure at the start of the record. By contrast, the two length-adjusted compressibility "shifts" clear the threshold only because every year-to-year move in that metric is minuscule; in absolute terms they are changes of 0.02–0.04 bits/byte and carry no practical weight. They are flagged here for completeness, and they confirm rather than contradict Section 3.2: length-adjusted compressibility is flat.
The measurements are descriptive and method-blind. They establish, with a full census behind them, that between 2011 and 2023 The Verge's output:
What the numbers do not do is name a cause. A longer, more concentrated, more internally varied, and increasingly uniform body of text is equally consistent with a shift toward long-form and explainer formats, a maturing content-management and templating pipeline, changes in staffing or house style, a drift in topic mix, or broader industry conventions — and this method cannot separate those hypotheses, because it never reads a single word. The statistical signature is offered here in full; the interpretation belongs to the reader.
Measured purely as symbols and bytes, The Verge moved over twelve years from short, comparatively varied, and volatile posts into long, internally consistent, and statistically settled articles. The headline "densification" that a raw compression reading suggests dissolves under length adjustment, leaving length growth and a quiet tightening of the symbol distribution as the two real, durable movements — both of them largely complete by 2019, after which the corpus holds a steady statistical shape through 2023.
Method: Shannon order-0 and order-1 entropy over Unicode code points, plus gzip compression over UTF-8 bytes, computed per article across the full recovered corpus (152,649 articles; 152,192 dated). No natural-language processing is used at any stage. Length adjustment follows the corpus's own rolling-median length→compressibility curve. Dates recovered from URL and byline tokens by pattern match only.