
 Dan Petrovic ·
10 August 2016
Dan Petrovic ·
10 August 2016
An open-ended survey of 1,000 web users on what makes online content trustworthy. Content properties and declared sources lead, ahead of publisher and author reputation, with pictures last.
In order of importance, the trust factors for online content are:
In 2015 we explained how users read online, and a follow-up study in 2016 revealed what people think of web links. This time we explore the trust factors for online content, or in other words, the clues web users rely on to decide whether online content is trustworthy.
Data collection was an open-ended survey of 1,000 web users. Each was asked to describe what quality signs they look for when evaluating online content. We used custom-built software to surface the top concepts by grouping similar themes, so "brand", "ABC", "gov", "URL" and "paper" all fall under "Publisher". A single respondent could contribute to several concepts in one answer. For instance "corroboration, quality of ads, correct grammar and spelling" contributed to two themes, "Content Properties" and "Presence of Ads".
Content quality is the primary factor in building trust online, though this category is a cluster of sub-themes:
Our study of what web users think of content links found that most see links as a marketing and revenue system. The second most common reason was to supply relevance, context and detail, with only 3% of respondents mentioning "proof and reference".
Here is the twist. Despite the negative sentiment towards links on the web, links are a major trust factor when users decide whether to believe a statement made online. The key to successful link placement is context.
The third most important factor is website reputation. That includes strong brand familiarity, a track record of quality content, or being an academic or government resource. Facing an unfamiliar publisher for the first time, users look up its credentials by visiting the "about us" and "contact us" pages, or searching for it.
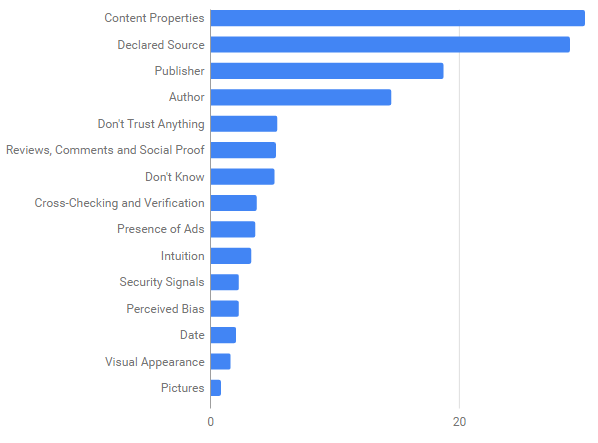
| Concept | Share | Answers |
|---|---|---|
| Content Properties | 30.13% | 273 |
| Declared Source | 28.92% | 262 |
| Publisher | 18.76% | 170 |
| Author | 14.57% | 132 |
| Don't Trust Anything | 5.41% | 49 |
| Reviews, Comments and Social Proof | 5.30% | 48 |
| Don't Know | 5.19% | 47 |
| Cross-Checking and Verification | 3.75% | 34 |
| Presence of Ads | 3.64% | 33 |
| Intuition | 3.31% | 30 |
| Security Signals | 2.32% | 21 |
| Perceived Bias | 2.32% | 21 |
| Date | 2.10% | 19 |
| Visual Appearance | 1.66% | 15 |
| Pictures | 0.88% | 8 |
Nonsensical answers were grouped and removed from the table.