A qualitative study comparing self-reported reading habits against actual user behavior, tracking mouse movements, scroll patterns, and time on page.
Our online reading habits have changed drastically over the last decade. Ten years ago, more than half of web visitors identified as readers. Today, that number has been cut in half, to just twenty-eight percent.
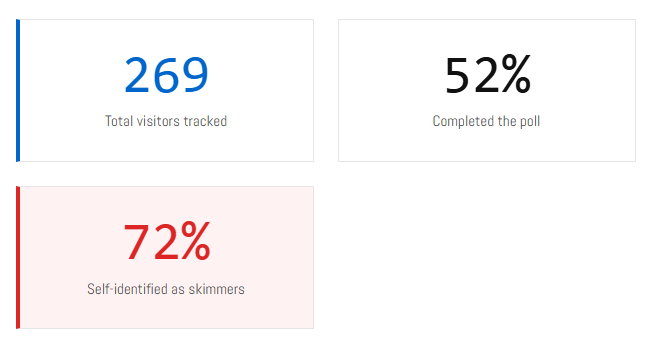
A recent study tracked user behavior to see if we actually read what we claim to. It turns out, thirty seconds is the ultimate cliff. Within thirty seconds, two-thirds of visitors have already left the page.
There is also a major gap between what we say and what we do. Only half of the people who called themselves readers actually behaved like one. On the other hand, some self-proclaimed skimmers actually spent a meaningful amount of time with the content, perhaps downplaying their habits in a culture where quick scanning is now the norm.
Where visitors come from matters, too. People arriving from LinkedIn are three times more likely to read than those coming from Facebook.
Ultimately, scrolling is not the same as reading. Almost everyone scrolls to the bottom of a page, but very few actually digest the words. For content creators, this means the first twenty seconds are everything. To hook your audience, you must front-load your value and make your key points easy to scan.
This is a qualitative study on a small number of anonymized users while collecting a very large number of datapoints from each one.

In December 2025, we published an article asking a simple question: Do you read or skim? We tracked 269 visitors using mouse movements, scroll patterns, and time-on-page data, then asked them to self-identify their reading behavior.
The goal was to compare self-reported behavior against actual behavior—and see how things have changed since our original 2015 study.
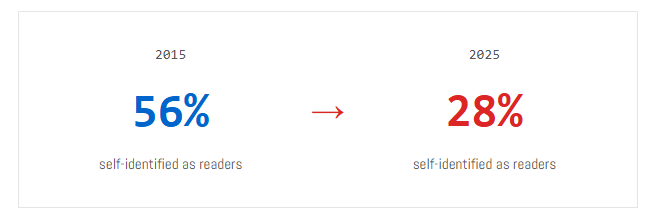
In 2015, when we combined “read everything in full” (16%) with “read most, may skip some parts” (40%), we got 56% of respondents who considered themselves readers. In 2025, that number has dropped to just 27.7%.
That’s a 28-percentage-point decline in a decade.
We tracked how long visitors remained on the page before submitting their response. The retention curve is steep:
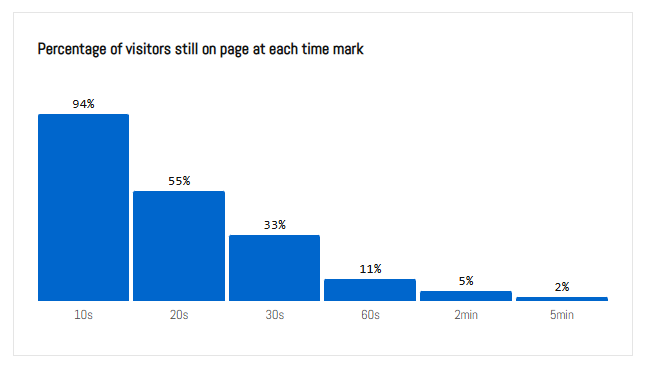
After just 30 seconds, two-thirds of visitors had already left or submitted their response. Only 11% were still engaged after one minute.
22s - Median time on page
Using median to exclude outliers
Here’s where it gets interesting. We compared what people said about their reading behavior against what they actually did.
We defined “reader behavior” as: spending more than 30 seconds on the page AND scrolling past 75% of the content.
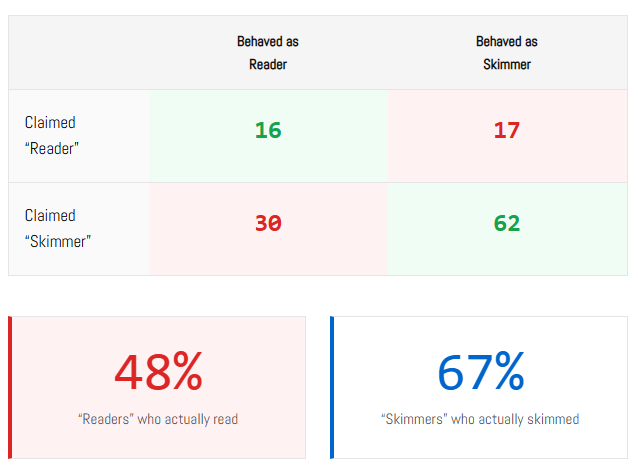
Only half of self-identified “readers” actually exhibited reading behavior. Meanwhile, 30 people who called themselves skimmers actually spent meaningful time with the content—perhaps they’re humble, or have simply accepted the cultural norm that “nobody reads anymore.”
The Aspirational Reader
We found 15 visitors who clicked “Reader” but spent less than 20 seconds on the page. We call these aspirational readers—people who believe they read, or want to believe they read, but don’t.
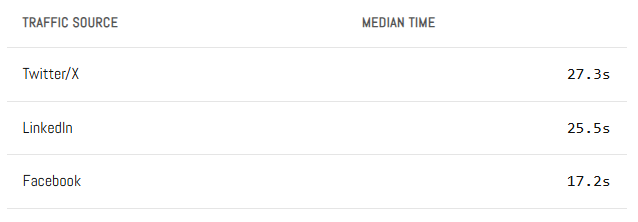
Where visitors came from significantly affected their reading behavior:
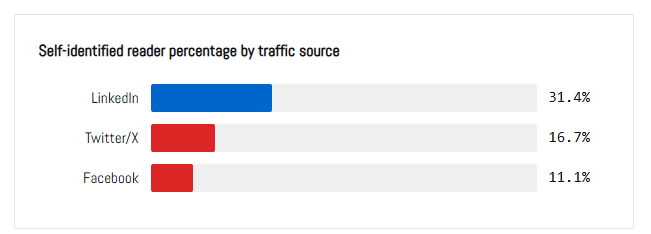
LinkedIn visitors were nearly 3x more likely to identify as readers compared to Facebook visitors. Twitter/X fell in the middle—perhaps unsurprising given the platform’s emphasis on rapid-fire content consumption.
Mobile visitors made up 70% of our traffic—reflecting the broader shift in how people consume content.
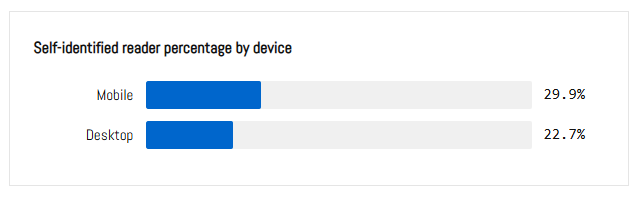
Counterintuitively, mobile users were more likely to self-identify as readers. However, desktop users generated significantly more engagement signals—a median of 154 tracked events compared to just 59 on mobile. This likely reflects the richness of mouse movement data versus touch interactions.
We created an “engagement score” based on total tracked interactions: mouse movements, scroll events, and clicks. Here’s how self-identified readers compared to skimmers:
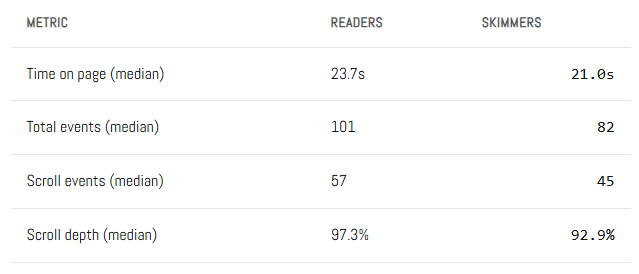
Self-identified readers showed 23% more total engagement and 28% more scroll events. But the time difference was minimal—just 2.7 seconds. Both groups reached near-complete scroll depth, suggesting most visitors at least scrolled through the entire article, even if they didn’t read it.
“We’ve shifted from a culture of reading to a culture of scanning. The question isn’t whether people will read your content—it’s whether they’ll give you 20 seconds to prove it’s worth reading.”
If you’re creating content for the web, here’s the uncomfortable truth: most people won’t read what you write. Not because your content is bad, but because scanning has become the default mode of information consumption.
This doesn’t mean long-form content is dead. It means the first 20 seconds matter more than ever. Front-load your value. Make your key points scannable. And accept that the minority who do read will be your most valuable audience.
This study tracked 269 unique visitors to a single article page on dejan.ai between December 25-30, 2025. We collected anonymous mouse movement, scroll, and click data using client-side JavaScript, and asked visitors to self-identify as “readers” or “skimmers” via an embedded poll.
All statistics use medians rather than means to account for outliers (visitors who left browser tabs open). Behavioral classification used thresholds of >30 seconds time-on-page AND >75% scroll depth to define “reader behavior.”
Traffic sources: LinkedIn (34%), Twitter/X (20%), Direct (25%), Facebook (7%), Other (14%).
 Dan Petrovic ·
Dec 30, 01:51
Dan Petrovic ·
Dec 30, 01:51
Sign in with Google to comment.