An analysis of 365,920 fanout queries from Google, OpenAI, and Amazon reveals how different AI models generate internal search queries for web grounding.
When AI models like Gemini, GPT or Nova answer a question using web search, they don’t just run your query as-is. They generate their own internal search queries, or fanout queries. A single user prompt can trigger multiple fanout queries as the model breaks down the question, explores subtopics and verifies information.
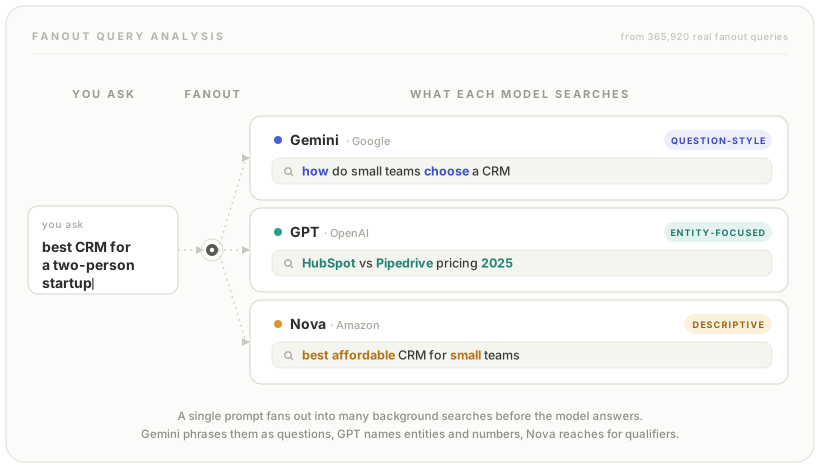
We captured 365,920 of these fanout queries across three providers, Google (Gemini), OpenAI (GPT) and Amazon (Nova), by logging the grounding metadata returned from their APIs during citation mining runs. This data comes from real production workloads across multiple projects, not synthetic benchmarks.
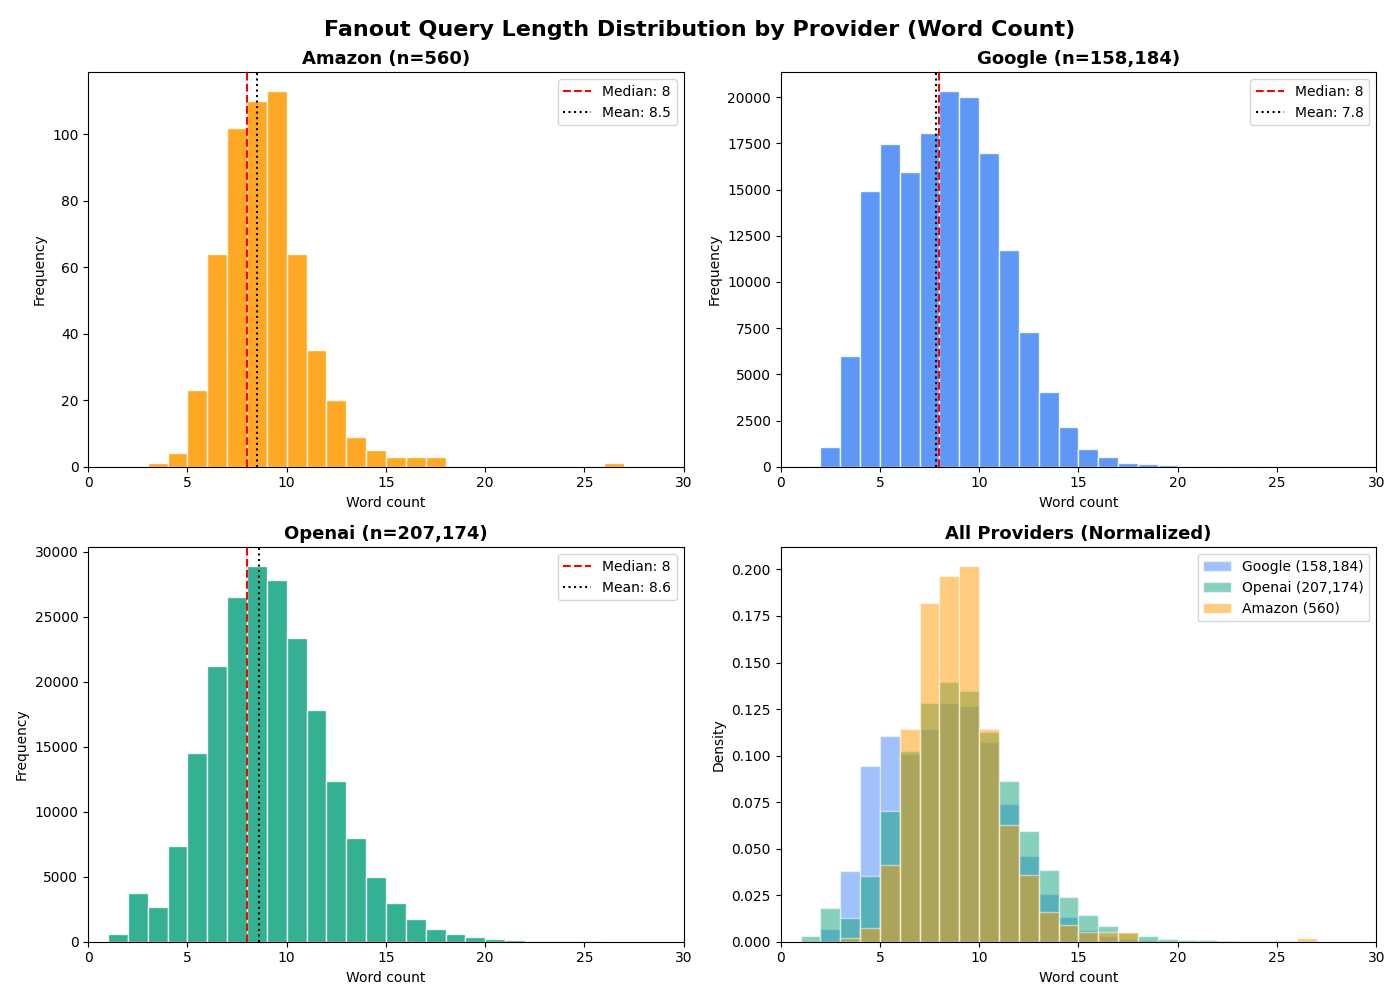
Below is an analysis of how these providers differ in the queries they generate.
| Provider | Count | Avg Chars | Min | Max | 1-3 words | 4-6 words | 7+ words |
|---|---|---|---|---|---|---|---|
| 158,186 | 52 | 0 | 252 | 4.5% | 30.6% | 64.9% | |
| OpenAI | 207,174 | 60 | 6 | 323 | 3.4% | 20.8% | 75.8% |
| Amazon | 560 | 59 | 28 | 198 | 0.2% | 16.2% | 83.6% |
| Total | ~365,920 | 56 | 0 | 323 | 3.9% | 25.0% | 71.1% |
Google (n=158,184)
| Words | Count | % | Cumul% |
|---|---|---|---|
| 1 | 53 | 0.0% | 0.0% |
| 2 | 1,092 | 0.7% | 0.7% |
| 3 | 5,994 | 3.8% | 4.5% |
| 4 | 14,916 | 9.4% | 13.9% |
| 5 | 17,471 | 11.0% | 25.0% |
| 6 | 15,923 | 10.1% | 35.1% |
| 7 | 18,080 | 11.4% | 46.5% |
| 8 | 20,325 | 12.8% | 59.3% |
| 9 | 20,013 | 12.7% | 72.0% |
| 10 | 16,968 | 10.7% | 82.7% |
| 11 | 11,740 | 7.4% | 90.1% |
| 12 | 7,316 | 4.6% | 94.8% |
| 13 | 4,043 | 2.6% | 97.3% |
| 14 | 2,124 | 1.3% | 98.7% |
| 15+ | 1,146 | 0.7% | 100.0% |
OpenAI (n=207,174)
| Words | Count | % | Cumul% |
|---|---|---|---|
| 1 | 616 | 0.3% | 0.3% |
| 2 | 3,715 | 1.8% | 2.1% |
| 3 | 2,691 | 1.3% | 3.4% |
| 4 | 7,360 | 3.6% | 6.9% |
| 5 | 14,516 | 7.0% | 13.9% |
| 6 | 21,221 | 10.2% | 24.2% |
| 7 | 26,544 | 12.8% | 37.0% |
| 8 | 28,912 | 14.0% | 51.0% |
| 9 | 27,861 | 13.4% | 64.4% |
| 10 | 23,354 | 11.3% | 75.7% |
| 11 | 17,875 | 8.6% | 84.3% |
| 12 | 12,339 | 6.0% | 90.3% |
| 13 | 7,983 | 3.9% | 94.1% |
| 14 | 4,959 | 2.4% | 96.5% |
| 15+ | 5,228 | 2.5% | 100.0% |
Amazon (n=560)
| Words | Count | % | Cumul% |
|---|---|---|---|
| 3 | 1 | 0.2% | 0.2% |
| 4 | 4 | 0.7% | 0.9% |
| 5 | 23 | 4.1% | 5.0% |
| 6 | 64 | 11.4% | 16.4% |
| 7 | 102 | 18.2% | 34.6% |
| 8 | 110 | 19.6% | 54.3% |
| 9 | 113 | 20.2% | 74.5% |
| 10 | 64 | 11.4% | 85.9% |
| 11 | 35 | 6.2% | 92.1% |
| 12 | 20 | 3.6% | 95.7% |
| 13 | 9 | 1.6% | 97.3% |
| 14 | 5 | 0.9% | 98.2% |
| 15+ | 10 | 1.8% | 100.0% |
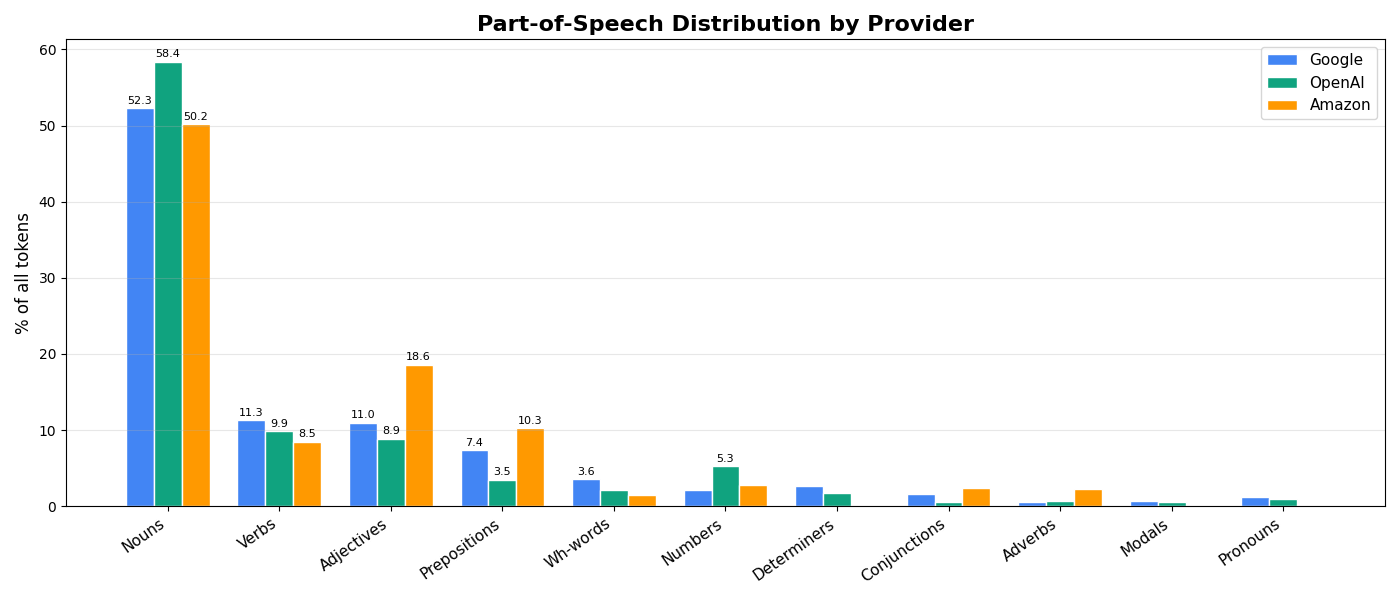
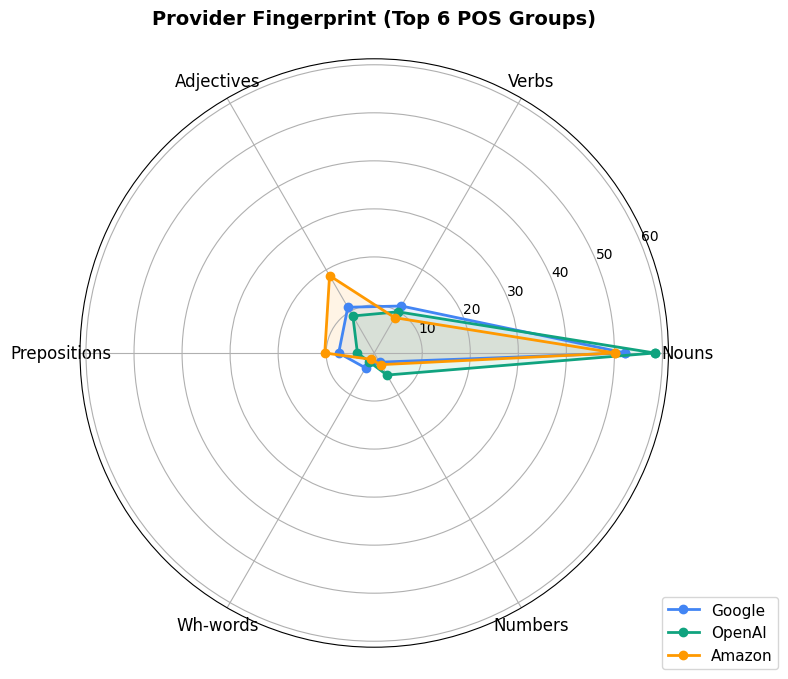
| Group | OpenAI | Amazon | |
|---|---|---|---|
| Nouns | 52.3% | 58.4% | 50.2% |
| Verbs | 11.3% | 9.9% | 8.5% |
| Adjectives | 11.0% | 8.9% | 18.6% |
| Prepositions | 7.4% | 3.5% | 10.3% |
| Wh-words | 3.6% | 2.1% | 1.5% |
| Numbers | 2.2% | 5.3% | 2.8% |
| Determiners | 2.6% | 1.8% | 0.1% |
| Conjunctions | 1.6% | 0.6% | 2.4% |
| Adverbs | 0.6% | 0.7% | 2.3% |
| Modals | 0.7% | 0.5% | 0.0% |
| Pronouns | 1.2% | 0.9% | 0.1% |
 Dan Petrovic ·
20 March 2026
Dan Petrovic ·
20 March 2026