
Compare your brand head to head with one competitor in AI answers
Benchmark puts your brand and one competitor side by side on the association, citation and tracking metrics in your project, so you can see which metrics a rival wins and which you win.
Start at app.dejan.ai
The problem: a brand league table hides where one rival beats you
The Dashboard ranks every brand named in the tracked answers for your topics. That table shows your position among hundreds of brands. It does not show which metrics separate you from the one competitor you lose deals to, because mention counts, rank in the answer, the kind of question and citations all sit in different places.
Here is an example from our public demo project. Algoroo tracks Google rank volatility. On the Dashboard for 26 October 2026, AccuRanker is 6th among the brands named in the tracked answers, with 44 mentions, and Algoroo is 11th with 18 mentions. The league table stops there. It does not say whether AccuRanker is ahead on every measure or on one.
How Benchmark solves it
Benchmark, in the Tools menu, compares your primary brand with one competitor you pick. It reads the project's stored association probes, citation data and visibility tracking snapshots and shows each metric for the two brands in adjacent columns, with the better value in bold. It makes no new AI calls.
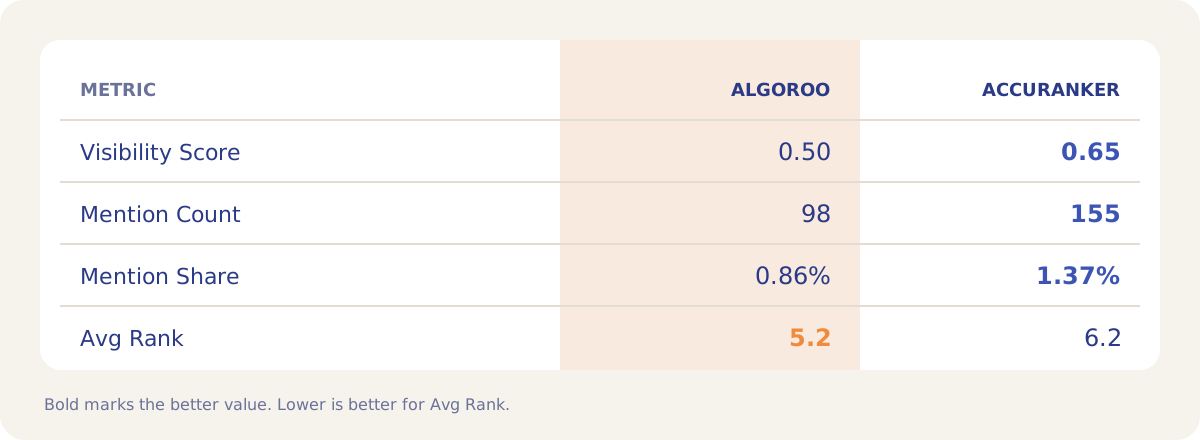
For Algoroo against AccuRanker, the demo project's data gives this Summary. AccuRanker has more mentions and a higher Visibility Score. Algoroo has the better average rank: when the association probes name Algoroo, they name it one place higher on average.
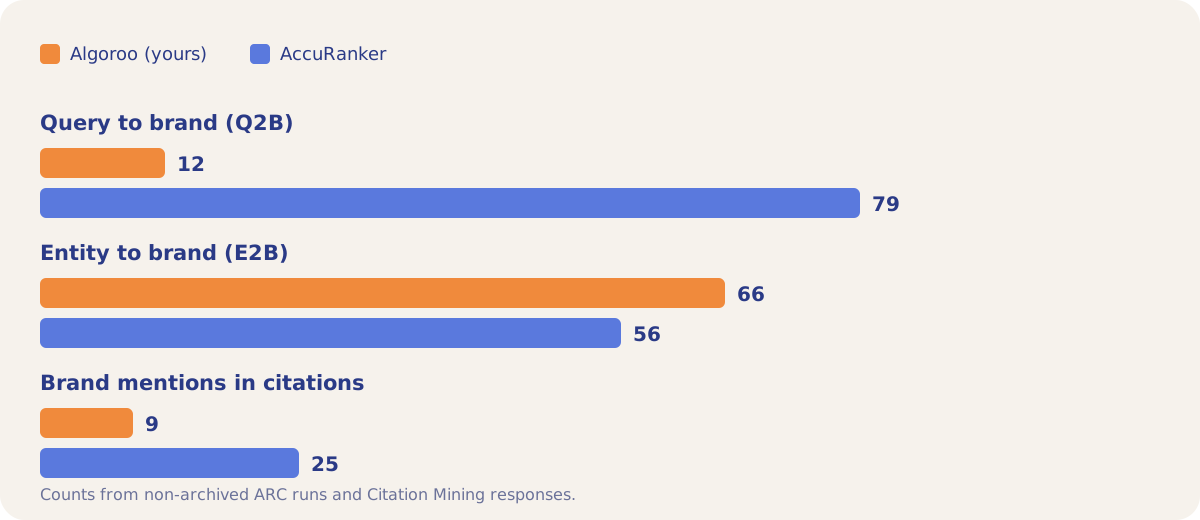
The Associations table splits the mentions by the kind of probe. A query-to-brand (Q2B) probe asks an AI model which brands fit a search query. An entity-to-brand (E2B) probe asks which brands it links to a topic. AccuRanker has 79 Q2B associations against Algoroo's 12. On E2B, Algoroo is ahead with 66 against 56. The citations side shows the same pattern as Q2B: in the Citation Mining answers, AccuRanker is named 25 times and Algoroo 9 times.
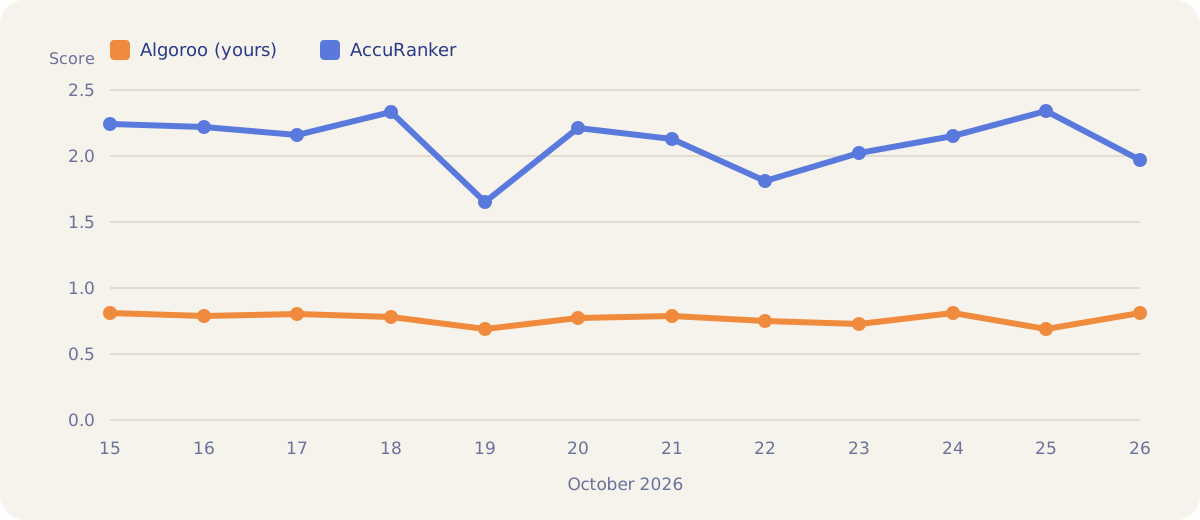
The Visibility Trend chart plots both brands from the daily tracking snapshots. In the 12 days from 15 to 26 October 2026, AccuRanker's visibility score stayed between 1.65 and 2.34 and Algoroo's between 0.69 and 0.81, so the gap held on every day.
How it works
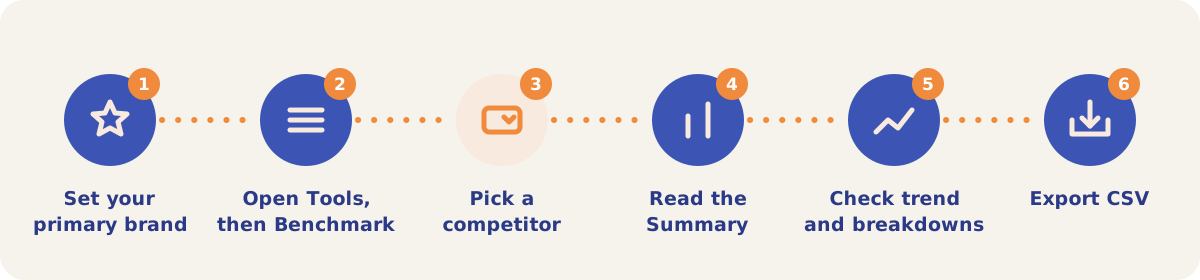
- Set your primary brand. On the Settings tab, open the Brands sub-tab, select your main owned brand and choose Set Primary (Owned). Benchmark compares this brand. Without one, the Benchmark tab shows "No primary brand configured".
- Open Benchmark. Open the Tools menu (the tools icon at the right of the tab bar) and pick Benchmark.
- Pick a competitor. The Compare against list holds every competitor brand in the project that is not a variant of another brand. Type to search it.
- Read the Summary. Visibility Score, Mention Count, Mention Share and Avg Rank, with the better value in bold, followed by a Visibility Score chart and a Mention Share vs Avg Rank chart.
- Check the trend and the breakdowns. Below the Summary are the Visibility Trend, the Associations table, Citations & Brand Mentions, Brand Mentions by Platform, and the By Category and By Platform tables where your project has that data.
- Export CSV. Once a competitor is selected, Export CSV downloads the comparison.
The metrics
| Metric | What it measures |
|---|---|
| Mention Count | How many times association probes named the brand, across non-archived runs. |
| Mention Share | The brand's mentions as a percentage of all brand mentions in the project. |
| Avg Rank | The brand's average position in the ranked brand lists the probes return. Lower is better. |
| Visibility Score | Mention Share weighted by rank: Mention Share × (11 − Avg Rank) ÷ 10. A brand at rank 11 or lower scores 0. |
| Associations | Mention counts and shares split into query-to-brand (Q2B) and entity-to-brand (E2B) probes. |
| Citations & Brand Mentions | Citation counts for each brand, and how often each brand is named in the Citation Mining answers. |
| Visibility Trend | Each brand's tracking Visibility Score per day. This is a different measure from the Summary's Visibility Score. |
| By Category, By Platform | Mentions, share and average rank per category and per AI platform. |
Strategies and use cases
- Read the probe split before you act. In the demo data, AccuRanker leads Q2B by 79 to 12 while Algoroo leads E2B by 66 to 56. AI models link Algoroo to the topic and name AccuRanker for the search queries.
- Separate frequency from position. A competitor can win on Mention Count and lose on Avg Rank, as AccuRanker does against Algoroo. Mentions say how often you appear in the association probes; rank says how high you appear when you do.
- Benchmark against more than one rival. Repeat the comparison for each competitor on your list. In the demo data Algoroo trails SEMrush on all four Summary metrics, while against AccuRanker it leads on average rank.
- Watch the trend after a content change. The Visibility Trend shows whether a gap narrows in the days after you publish.
How it connects to the rest of the app
Association Probes
Produces the Q2B and E2B mentions behind the Summary and Associations tables.

Visibility Tracking
Records the daily snapshots plotted in the Visibility Trend.

Citation Mining
Supplies the citation counts and the brand mentions in its answers.
Dashboard
Ranks every brand, which tells you which competitor to benchmark.

Gap Analysis
Turns the association and citation gaps into a written strategy.

Content Optimizer
Tests page edits for the queries where a competitor outranks you.
Open the demo project's Dashboard to see Algoroo's Owned Rank (#11) and AccuRanker in Top Brands by Mentions.
Benchmark your brand
Your first project includes a complimentary visibility baseline. No card required.