
See how often the tracked answers name your brand and link to your site, on one page
The Dashboard is the overview of a project: it turns thousands of tracked AI answers into your share of mentions and citations per platform and per entity, so you can see where you are missing and what changed.
Start at app.dejan.ai
The problem: AI visibility is spread across platforms, entities and thousands of answers
Google, OpenAI and Anthropic each answer the same question with a different list of brands and a different set of sources. A brand can be named in an answer and still get no link, and it can do well on one platform and be absent on another. Reading the answers one by one does not show the pattern, and a single "AI visibility" number hides which half of the problem you have.
Here is an example from our public demo project. Algoroo tracks Google rank volatility, and the app tracks 63 entities for it on three AI platforms. By 27 October 2026 the tracked answers had named Algoroo 756 times out of 40,456 brand mentions, and had cited an algoroo.com page 87 times out of 15,265 citations. In share terms, the tracked answers name the brand 3.3 times as often as they link to it.
How the Dashboard solves it
Every share figure on the Dashboard comes from Visibility Tracking, which is a test, not a measure of demand. It asks each AI platform the same question about each tracked entity on a fixed schedule, so you can see whether your work, such as a Content Optimizer run or an outreach campaign, changes which brands the platforms choose and how they describe yours. The figures show how often your brand appears in those test answers. They do not show how many people ask about a topic, what they type, or how often a real user sees your brand.
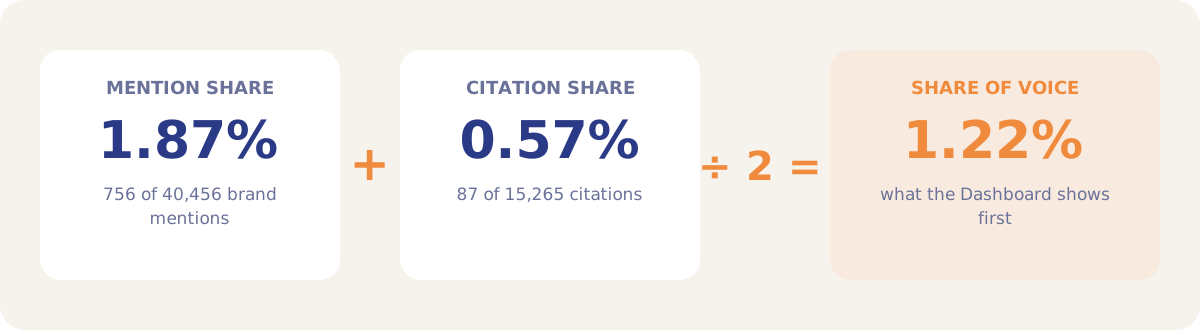
The Dashboard reads every answer that Visibility Tracking has stored for the project and reduces it to a few figures that you can compare over time. The first card is Share of Voice, the average of two shares: Mention Share (your brands among all brands that the tracked answers name) and Citation Share (your domains among all sources that the tracked answers cite). Both shares count every brand and every domain that appears, so you do not need a competitor list for the numbers to work.
On the demo Dashboard, Share of Voice was 1.22%. Mention Share was 1.87% and Citation Share was 0.57%, so the weak half is citations.

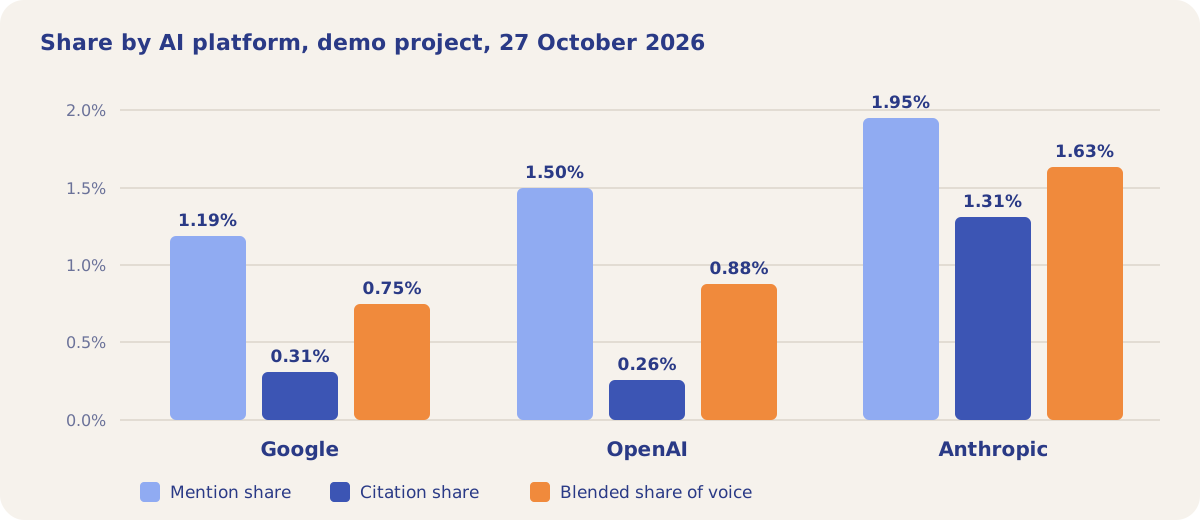
The By AI Platform cards split the same figures by platform. In the demo, Anthropic answers cited algoroo.com in 1.31% of their citations. Google answers did so in 0.31% and OpenAI answers in 0.26%, although both named the brand in more than 1% of their brand mentions.
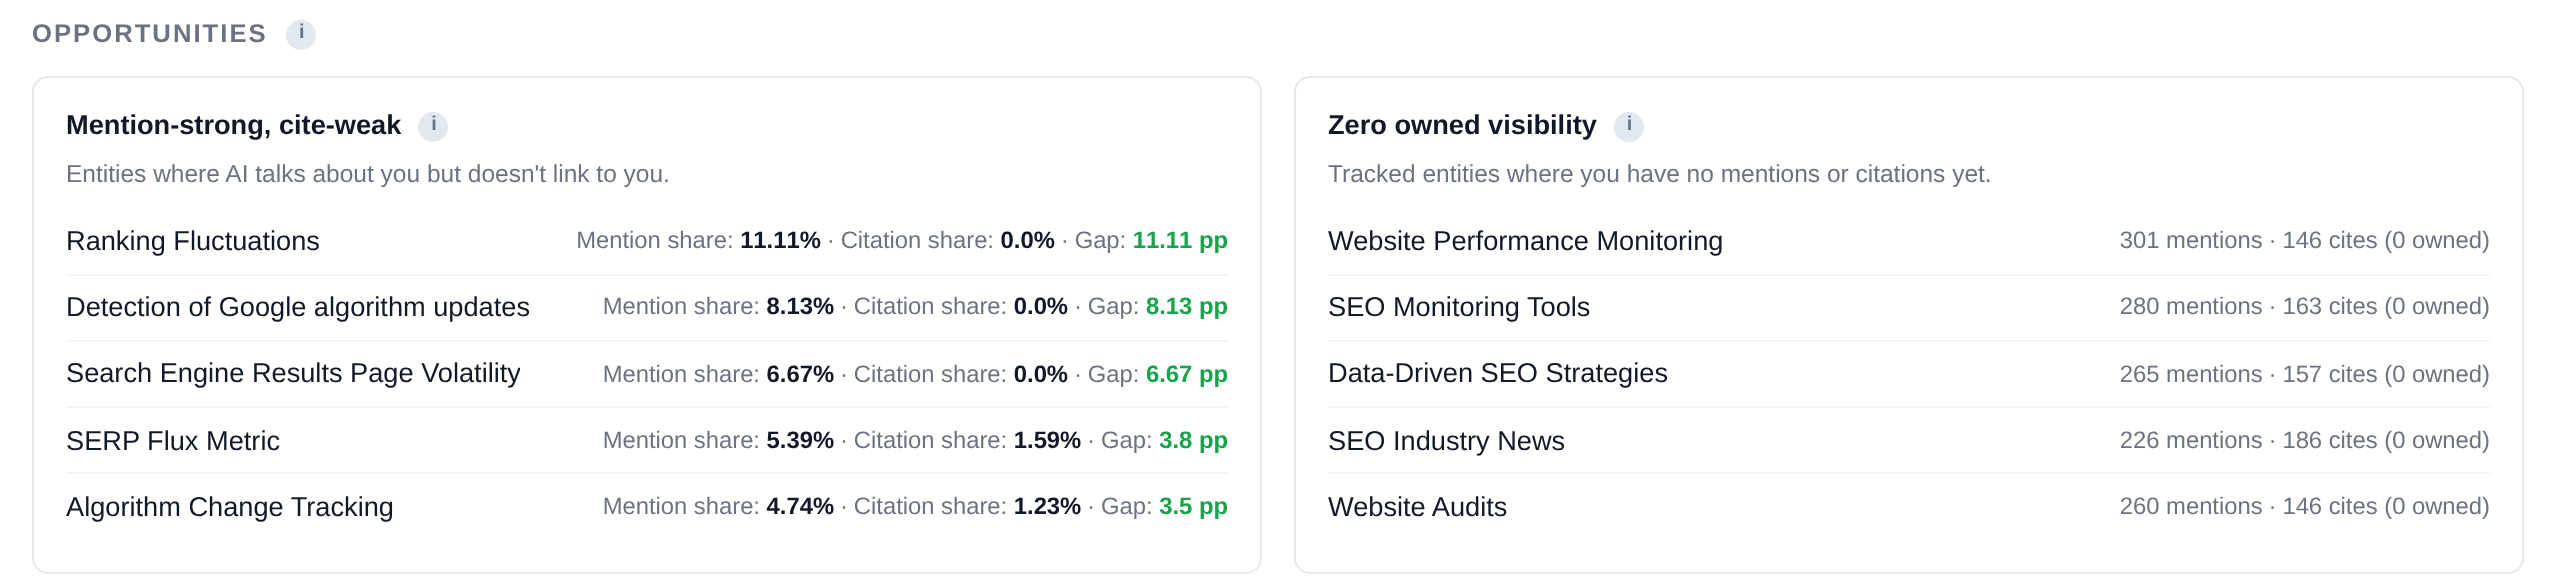
The Opportunities section turns the gap into a list of entities. Mention-strong, cite-weak lists the entities where your Mention Share is at least 1 percentage point above your Citation Share. In the demo, the tracked answers about "Ranking Fluctuations" named Algoroo in 11.11% of brand mentions and never cited algoroo.com. Zero owned visibility lists the entities where the tracked answers name and cite other brands and never yours: "Website Performance Monitoring" had 301 mentions and 146 citations, none of them Algoroo.
How it works
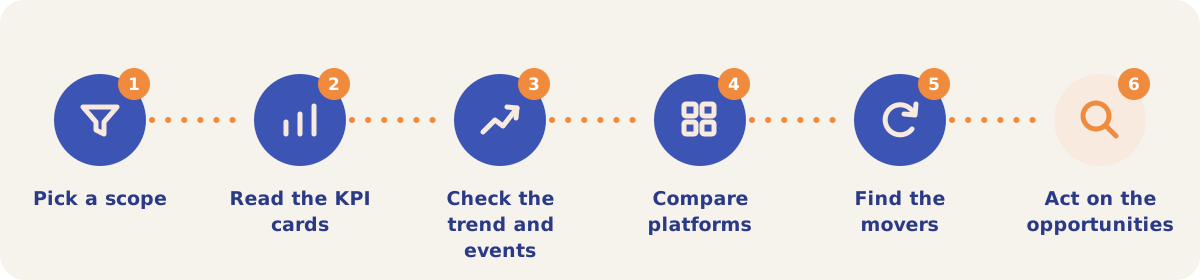
- Pick a scope. The Filter By dropdown at the top scopes the whole page to Everything, to the entities in a category or with a tag, or to the brands in a category or with a tag. A "Page scoped to" banner shows the active filter.
- Read the KPI cards. Share of Voice, Mention Share, Citation Share, Owned Rank (where your brand sits among all brands named on the latest tracking day), Entities and Last Run. A one-line Insights summary under the cards gives the 7-day change, the strongest platform and the top gaining entity.
- Check the trend and the events. Visibility Trend plots Share of Voice over the full tracking history, with Mention Share and Citation Share as dashed lines. Purple markers show events, such as a Content Optimizer run marked Implemented or an optimization logged on the Pages tab. Mentions & Citations shows the daily counts behind the shares.
- Compare platforms. The By AI Platform cards give Mention Share, Citation Share and a blended Share of Voice for each platform. Top brands by mentions and Top cited domains show who takes the rest of the share.
- Find the movers. Visibility by Entity ranks every tracked entity by its own Share of Voice. Movers lists the five biggest gains and losses over the last 7 days.
- Act on the opportunities. Each entity links to its detail page, and on the Entities sub-tab of the Visibility tab the "Optimize this entity" button opens the Content Optimizer for it.
Charts and cards on the Dashboard
| Section | What it shows |
|---|---|
| Visibility Trend | Share of Voice over time, with event markers. A By category dropdown splits it by category. |
| Mentions & Citations | Daily counts of your brand mentions and your domain citations. |
| Parametric Visibility | Your Mention Share in answers written from memory, with web search off. In the demo it was 0.54% after 15 rounds. |
| Organic clicks and Algorithm volatility | Google Search Console clicks (when connected), next to the market-wide volatility score from algoroo.com for the same days. |
| AI ranking volatility | How much the brands named in AI answers change between consecutive probes, with Overall, Google, OpenAI and Anthropic pills. It uses the same metric as the public dejan.ai/flux index. |
| By AI Platform | Mention, citation and blended share per platform. |
| Top brands by mentions, Top cited domains | The 10 brands and 10 domains with the most mentions or citations on the latest tracking day, with the 7-day change. |
| Brand Associations | What AI systems list when they are asked what they associate with your brand. |
| Entity Relevance | Your highest and lowest AI Relevance Scores by entity. |
| Visibility by Entity, Movers | Share of Voice per entity, and the biggest 7-day changes. |
| Opportunities | Mention-strong, cite-weak entities and entities with zero owned visibility. |
Strategies and use cases
- Find out which half of Share of Voice is weak. If Mention Share is well above Citation Share, as in the demo (1.87% against 0.57%), the work is on the pages that AI systems could cite. If both are low, the brand is missing from the answers.
- Start with Mention-strong, cite-weak entities. The tracked answers already name you for these topics. In the demo, "Ranking Fluctuations", "Detection of Google algorithm updates" and "Search Engine Results Page Volatility" had 0.0% Citation Share.
- Plan content for zero owned visibility entities. These are topics where the tracked answers name other brands only. In the demo, five of them had between 226 and 301 brand mentions each.
- Check the weakest platform. The demo's blended Share of Voice ranged from 0.75% on Google to 1.63% on Anthropic. A platform gap points to the sources that platform uses.
- Read changes against the event markers. Log each content change on the Pages tab or mark a Content Optimizer run Implemented, and the change shows as a marker on Visibility Trend.
- Scope the page to one product line. Use Filter By with an entity category or tag to read the same cards for one part of the business.
How it connects to the rest of the app

Visibility Tracking
Collects the tracked answers that every Dashboard figure is built from.
Measuring Relevance
Supplies the AI Relevance Scores in Entity Relevance.
Running Association Probes
Supplies the Brand Associations card: what AI systems link to your brand.

Content Optimizer
Runs marked Implemented show as markers on Visibility Trend.

Pages
Logged page optimizations show as markers on Visibility Trend.

Organic Search
Supplies the Search Console clicks in the Organic clicks chart.
Open the demo project's Dashboard to see the live figures for Algoroo.
See your own AI visibility
Your first project includes a complimentary visibility baseline. No card required.